Home » Articles posted by William Boos
Author Archives: William Boos
Afghanistan: deadly floods after years of drought
by William Boos
In a country whose name has become synonymous with generations of war, the past year has been marked by multiple climate catastrophes. First, drought brought a massive food crisis to over 10 million people, stunting the growth of about 40% of children under 6 years of age, and forcing hundreds of thousands of people out of their homes. Then too much water arrived in early 2019, with heavy snow blocking passage between regions and intense rainfall destroying homes and killing at least 63 people.
Afghanistan lies only a bit northwest of India, but unlike that monsoonal nation it receives most of its water in winter. In summer, the heavy rainfall over India and Bangladesh excites a continental-scale atmospheric wave that causes dry air to descend over Afghanistan and much of Pakistan. Afghanistan’s water arrives when the strong midlatitude jet stream hits the western edge of the Tibetan Plateau in winter, causing water to condense and precipitate as it rises over the mountainous terrain. But in late 2017, only a bit of precipitation fell when the wet season should have started, and by the end of that winter less than half of the normal water had been received. The following summer was even drier than usual, and the dryness continued through the end of 2018.
Afghanistan is a nation of farmers, with about 80% of its population making its living through agriculture, so drought can be particularly devastating. Not only is locally grown food destroyed by hydrological extremes, but the economic activity that would allow people to purchase imported food is also compromised. In the 2017-2018 drought, over 90% of farmers reported having insufficient or even no seed to sow in the planting season. The United Nations Food & Agriculture Organization classified 11 million people as being severely food insecure, with 2 million children under the age of five being acutely malnourished.

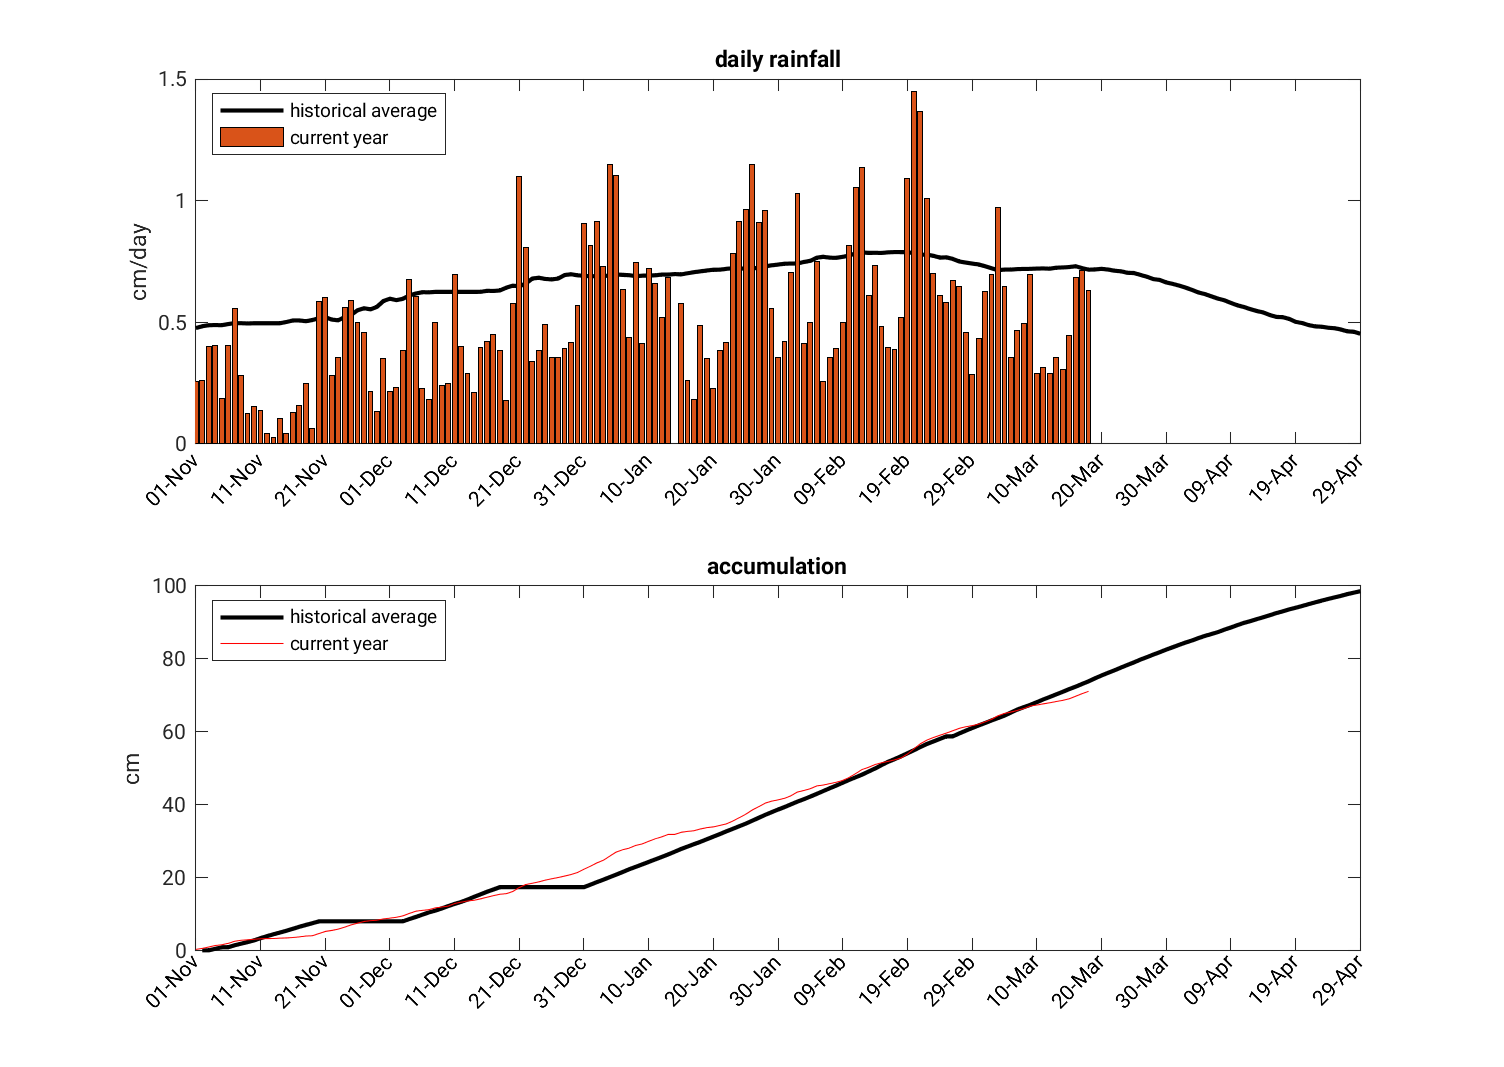
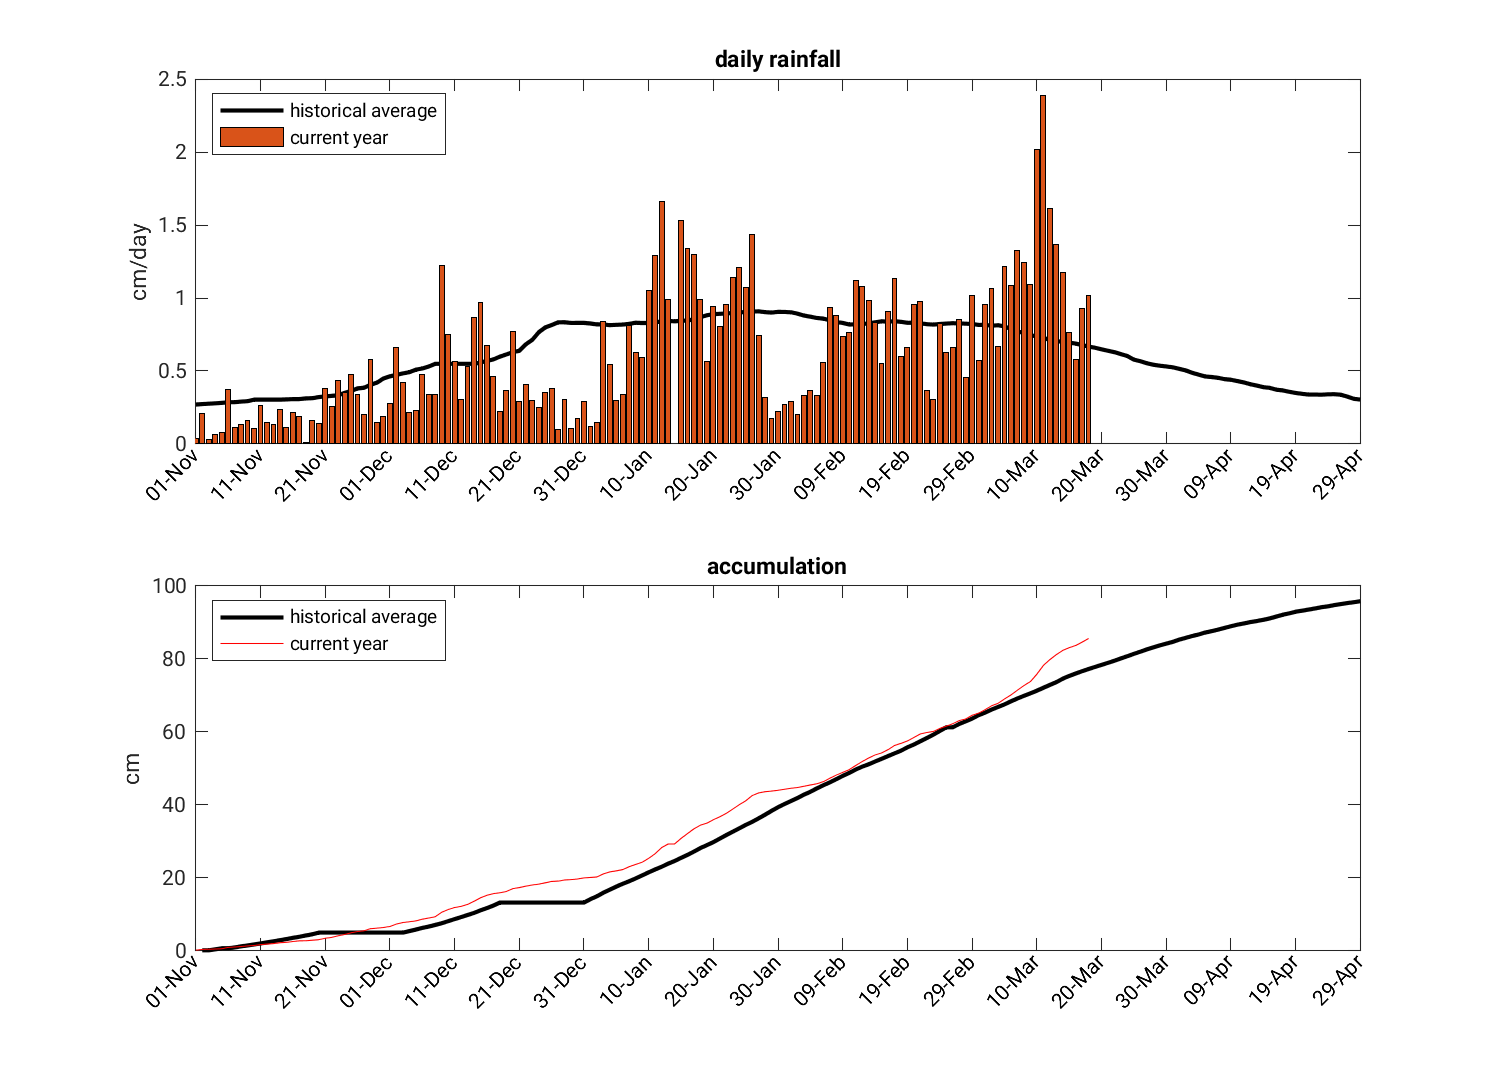
After more than a year of severe drought, the snow and rain began to fall in early 2019. It took until early February for the region to catch up to its normal amount of water accumulation, but then the water continued to come. Now, in early April 2019, almost 50% more precipitation has fallen than the long-term historical average for this time of year. After the worst drought in decades, torrential rains killed planted seeds and flash floods swept away people driving in cars; over 12,000 homes were damaged or destroyed by floods.
Why the drought and subsequent floods? El Niño (and its sister La Niña) may be to blame. The waters of the eastern equatorial Pacific cooled in autumn of 2017 as a La Niña episode emerged and persisted through spring of 2018, spanning Afghanistan’s rainy season. Southwest Asia tends to be dry during La Niña winters, seemingly due to changes in the jet stream in that region; it also tends to be wet during El Niño winters (when the eastern equatorial Pacific is warm instead of cold). With an El Niño event emerging in fall 2018, the too-wet rainy season we are seeing now fits the pattern well. Indeed, a wet rainy season for Afghanistan was projected in the seasonal forecast that was issued in November of 2018 by the IRI at the Lamont-Doherty Earth Observatory (see figure below).

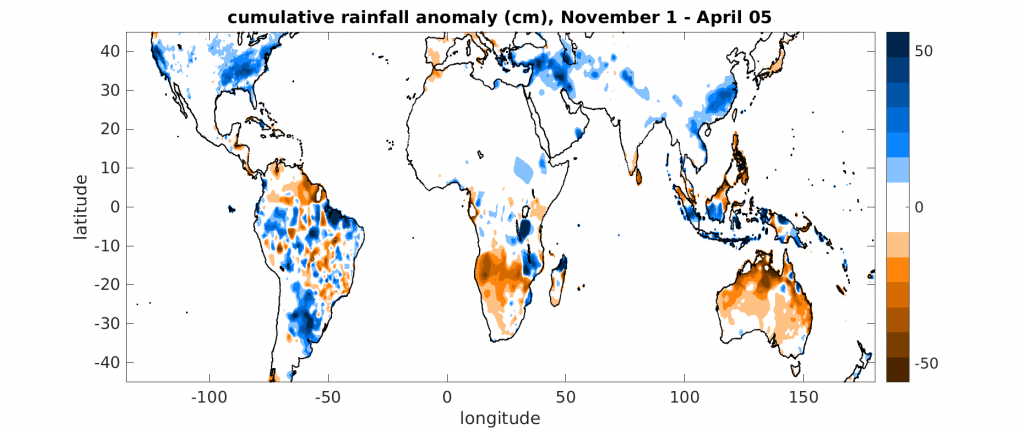
El Niño seems remarkably relevant for the global pattern of flood and drought that has occurred this winter. Australia, southern Africa, and northern South America are dry (see orange regions in below plot), as is typical for an El Niño year (see blue regions two plots prior, which show where rainfall is negatively correlated with the Niño-3.4 index). Eastern China, southwestern Asia, the southeastern U.S., and southeastern South America are wet (blue regions in below plot), which also match the typical El Niño impacts. Of course, the current wet and dry regions don’t match the historical impact patterns exactly, but once you knew El Niño had arrived this past fall, you would have done pretty well if you just used the historical anomaly maps to predict rough regions on the planet that would be abnormally wet or dry.
How will Afghanistan fare in coming months? The IRI forecast includes continued wet weather this spring and early summer, part of a broader pattern of wetness across southwestern Asia. This brings hope for the future, with projections of the wheat harvest being optimistic and rangeland conditions for livestock expected to improve. The Famine Early Warning System Network reports that agricultural labor opportunities have improved some since the drought. But the benefits of this spring’s abundant water supply seem to still lie mostly in the realm of future potential rather than current reality: agricultural labor opportunities, though improved, remain below-average, and non-agricultural labor opportunities also remain below-average. Wages are unchanged and livestock prices are low. Any improvements, furthermore, must contend with the background of armed conflict in the region.

References
http://fews.net/central-asia/afghanistan
South American monsoon
The maximum precipitation moves from the northern end of South America in the Southern Hemisphere’s winter to the central Amazon river basin in the Southern Hemisphere’s summer (November – March). That is monsoon season in South America and brings rainfall to much of the Amazon rainforest.
Forecast for wind and precipitation
This animation shows the forecast of precipitation (color shading) and horizontal winds at 850 hPa, which is about 1.5 km above sea level. The precipitation is the accumulation over the previous 6-hour period, in millimeters (1 inch = 25 mm), and winds are measured in m/s (1 m/s = 2.2 miles per hour). This is from a single deterministic forecast. The red box outlines the region over which the total accumulation of rainfall for this season (shown below) is averaged.
All forecast data is from the Global Ensemble Forecast System (GEFS) of the U.S. National Centers for Environmental Prediction (NCEP). All forecasts use an initial atmospheric state at the time indicated on the plot (note that 00Z is midnight Universal Coordinated Time, which is 8 pm the previous day in central Brazil (Manaus), Australia or 7 pm in New York [EDT]).
Seasonal accumulation
The below plots show the daily rainfall and the total seasonal accumulation of precipitation for central South America (70-40W, 16-2S), compared to the historical average.
Australian monsoon
The northern end of Australia receives most of its precipitation during its summer monsoon season, which typically occurs during December – March.
Forecast for wind and precipitation
This animation shows the forecast of precipitation (color shading) and horizontal winds at 850 hPa, which is about 1.5 km above sea level. The precipitation is the accumulation over the previous 6-hour period, in millimeters (1 inch = 25 mm), and winds are measured in m/s (1 m/s = 2.2 miles per hour). This is from a single deterministic forecast.
All forecast data is from the Global Ensemble Forecast System (GEFS) of the U.S. National Centers for Environmental Prediction (NCEP). All forecasts use an initial atmospheric state at the time indicated on the plot (note that 00Z is midnight Universal Coordinated Time, which is 9:30 am in Darwin, Australia or 8 pm the previous day in New York [EDT]).
Seasonal accumulation
The below plots show the daily rainfall and the total seasonal accumulation of precipitation for the “top end” of Australia (120-146E, 20-5S), compared to the historical average.
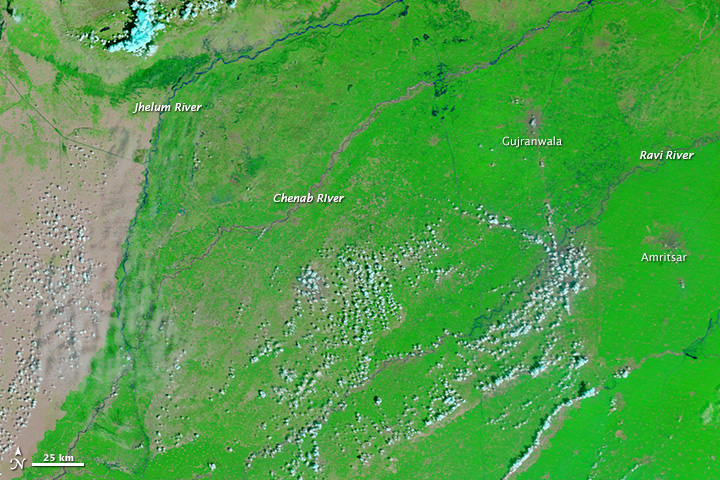
Floods kill hundreds in Kashmir
From September 3 – 7, about 12 inches of rain fell in the India-Pakistan region of Kashmir. The resulting flooding has resulted in a death toll of at least 200, and well over 100,000 people were rescued by the military. NASA’s Terra satellite shows the dramatic expansion of the region’s rivers between August 31 and September 11 to 10 km-wide channels stretching for hundreds of kilometers:
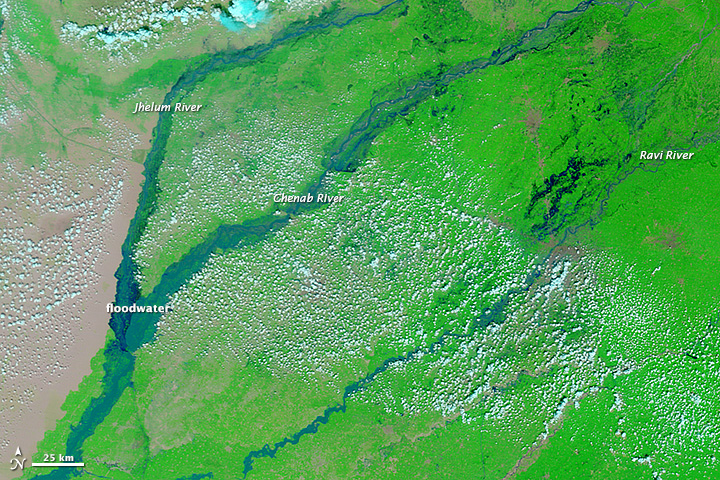
This torrential rainfall was produced by a monsoon depression — a type of storm that is substantially weaker than a typhoon but can pass over land without loss of intensity. An average of 5 or 6 monsoon depressions form every year in the Indian region, with most originating over the ocean east of India and then propagating to the northwest. This particular one seems to be fairly intense (animation compiled from images obtained from Yoshi Kajikawa’s monsoon site at the University of Hawaii):
There is some discussion of this monsoon depression interacting with an eastward-propagating midlatitude disturbance, thereby producing the extreme rainfall observed in the region. Further analysis is needed to understand the meteorology of this event, why it produced such unusually strong rainfall in what has this season been an otherwise fairly dry region, and how often similar extreme events should be expected in the future.
The lesser-known monsoon droughts
India tends to dominate the monsoon-related news this time of year, despite the fact that there are multiple other monsoon regions that may be experiencing hydrological events that are just as extreme. This year is a case in point: about 80% of the recent links in a Google news search on “monsoon” relate to India and Nepal, in particular to the floods and landslides that killed at least 50 people there. The other 20% refers mostly to the North American monsoon, in particular to the U.S. portion. (Note that the recent precipitation events in India, though deadly, are part of several rainy episodes occurring since mid-July that have brought India as a whole up from 40% below normal precipitation to “only” 17% below normal.)
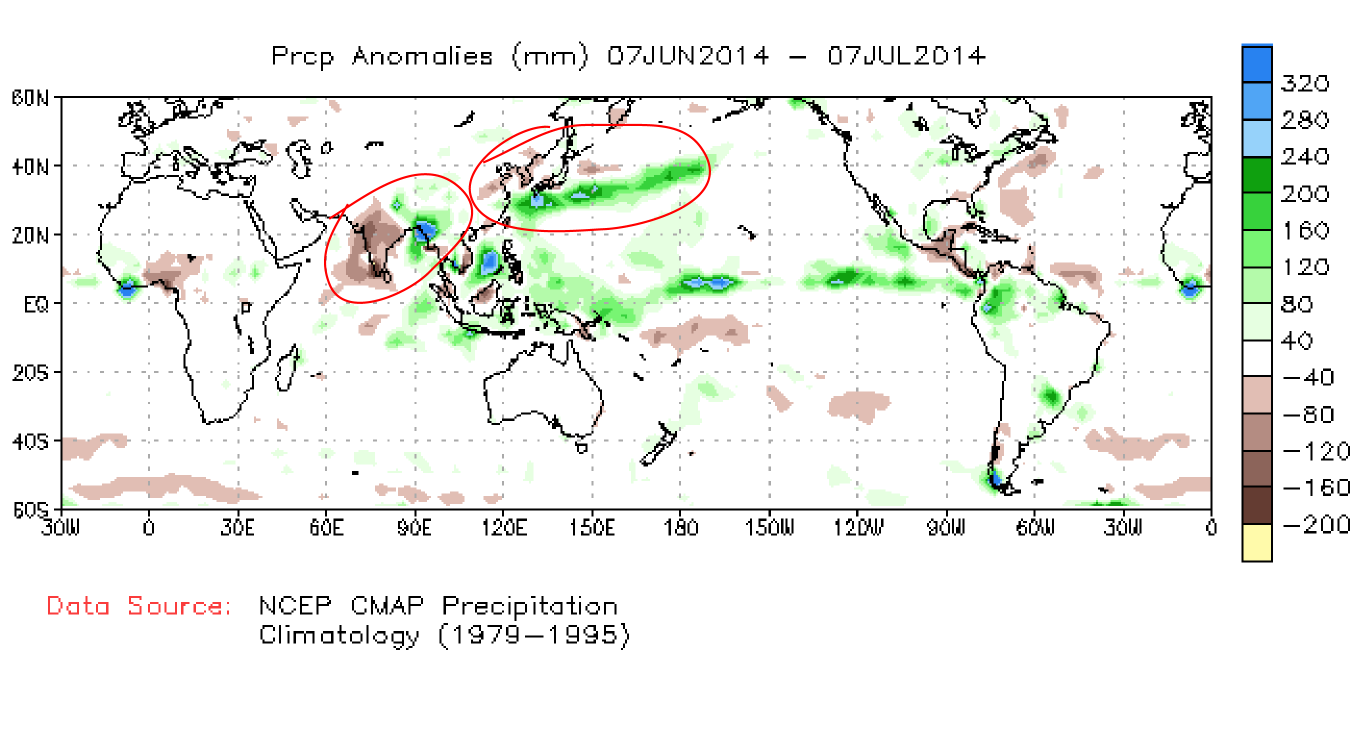
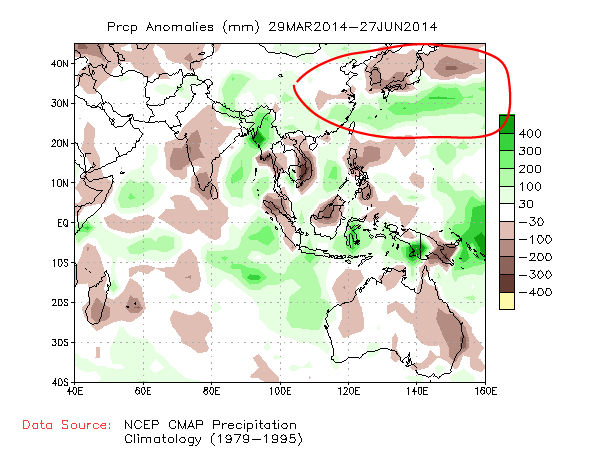
Our point is that there are fairly severe droughts in other world monsoon regions that have gotten comparatively little attention. Equatorial Africa and South America are currently experiencing dry anomalies even stronger than the one in India. That can be seen on our website here, as well as in this map of precipitation anomalies in the last 6 months:
Rainfall is particularly below normal in Venezuela, but it is interesting that this was predicted and seemingly planned for to some degree. Back in early June the Venezuelan government predicted half the normal precipitation for the 2014 rainy season because of the effects of the developing El Nino. Perhaps this can be viewed as a successful prediction, even though that El Nino event has thus far proven to be weak, at best. Nevertheless, there is still suffering, with news articles reporting reduced crop planting and elevated cattle mortality in the severe drought. News coverage of this, though, is fairly scant.
We also mentioned that equatorial Africa has less rain than usual, especially parts of Nigeria, Cameroon, and the Congo. But it is difficult to find reports of widespread severe drought in those regions via the usual web searches, and the Famine Early Warning System Network (FEWS NET) is not reporting agricultural drought there. So one wonders if this below-average rainfall is just not that much of a stress because the average rainfall is so high, or if there is perhaps some error in some of the gauge-based rainfall dataset that we have been using, or if news agencies simply haven’t picked up on local conditions.
Finally, the drought in at least some of the Korean peninsula seems to have been lessened by, unfortunately, torrential rains that have led to floods. These floods have led to deaths, displacements, and destruction of farmland and residences.
These were just a few words to bring attention to some of the hydrological extremes happening in monsoon regions outside of India. Over time we hope to build a collection of links to other websites that provide real-time updates on tropical weather events and their impacts; we don’t currently know of any single site that does this, but suggestions are very welcome.
Are the Korean and Indian droughts caused by warm oceans?
The precipitation anomalies that began this summer’s monsoon season have mostly persisted: a large dry anomaly over central and northern India and a band of dryness over northeast coastal China and the Korean peninsula. These can be seen in maps of anomalous precipitation over the past 30 days:
These dry anomalies seem to be predominantly part of a spatial shift in the normal maximum, from India toward the east over Bangladesh and Myanmar, and from the Korean peninsula toward the south. Although India does not seem to be in a formal “drought” yet, there are widespread reports of impacts from high temperatures and dryness over much of the region, with some large-scale economic effects. North Korea does seem to be in a severe drought state, with media reporting the driest conditions in over a decade and deleterious effects on agriculture.
What has caused these dry conditions? Is the dryness in Korea and India related, or is it just a coincidence that the normal rainfall maximum have shifted eastward over South Asia and southward over East Asia? While it is not possible to answer these questions definitively without much more detailed investigation than I can do on a blog, it is intriguing that sea surface temperatures (SSTs) are warmer than usual over the tropical West Pacific:

In the above map of SST anomalies for the past month, you can see warm anomalies in the equatorial East Pacific associated with what might be the development of an El Nino event, as well as warm anomalies of about 1 K in the West Pacific. Perhaps the warm West Pacific is essentially causing an eastward shift of the South Asian rainfall maximum and a southward shift of the East Asian maximum. The latter is organized in what is called the Maiyu-Baiu front, an east-west band of precipitation that stretches from China to the east of Japan, and this band seems to be shifted south of its normal position so that it now lies more over the cold SST anomalies just south of Japan. So an auxiliary question is: are the cold SSTs a response to the cloudiness of the shifted Maiyu-Baiu front, or is the front responding to the SST anomalies? There has been some research into connections between this front and SST, although I am not very familiar with this and there seem to be many open questions. Or perhaps the cause of the Asian rainfall anomalies is the warm SST in the equatorial East Pacific, or something altogether different from SST.
It will be interesting to see if some of these precipitation anomalies continue, especially if we head further toward an El Nino state. Current predictions from the Indian Institute of Tropical Meteorology are for enhanced monsoon rainfall over central and northern India in the coming week or so, with the west part of India remaining dry for the next two weeks. The U.S. forecast model (NCEP’s GFS) is also predicting above-normal rain over central India over the next week, but continued dryness over N. and S. Korea:
Let’s check back in a week or two to see what has happened with Indian and Korean drought.
Welcome to the Yale monsoon blog … and the 2014 boreal summer monsoon season!
We’ve created this website to provide a collection of observations, forecasts, news, and discussion about all of Earth’s monsoon regions. We are in the midst of the northern hemisphere summer monsoon season, which has been most remarkable in India because of the lack of rainfall over much of that country — much of central and northern India have received only about half their typical rainfall since the start of the monsoon season.
The above plot shows the fraction of normal precipitation received over the last 90 days in the Asian-Australian monsoon season, and although there are also anomalous dry regions over the Middle East and parts of Australia, those regions are less remarkable just because they are usually quite dry at this time of year (in other words, the absolute rainfall anomaly is not nearly as large there).
The Meiyu-Baiu front — the east-west oriented rain band that brings precipitation to much of China and Japan during summer — is also unusual in that it is located further south than usual at this time of year, as you can see from the north-south dipole in these precipitation anomalies:
OK, that’s it for now, but look forward to more news about the world’s monsoons as the summer season evolves!
Current season rainfall totals
The total seasonal accumulation of rainfall can be obtained from multiple sources, but few sources provide both near-real time global coverage and a historical climatology for comparison. Here we use the U.S. Climate Prediction Center’s Unified Gauge-based Analysis of Global Daily Precipitation.
Here is the anomalous accumulation of precipitation since the start of the summer season:

The above anomaly is computed relative to a daily climatology from 2006-2013:

Northeastern U.S. (with additional details for New Haven)
The northeastern U.S. is far from any monsoon region, but forecasts for this region are shown because it is home to Yale University, which hosts this website. We show additional details for New Haven, Connecticut.
All forecast data is from the Global Ensemble Forecast System (GEFS) of the U.S. National Centers for Environmental Prediction (NCEP). All forecasts use an initial atmospheric state at the time indicated on the plot (note that 00Z is midnight Universal Coordinated Time, which is 8 pm the previous day in New Haven [EDT]).
Forecast for wind and precipitation
This animation shows the forecast of precipitation (color shading) and horizontal winds at 850 hPa, which is about 1.5 km above sea level. The precipitation is the accumulation over the previous 6-hour period, in millimeters (1 inch = 25 mm), and winds are measured in m/s (1 m/s = 2.2 miles per hour). This is from a single deterministic forecast; the ensemble, probabilistic forecast for New Haven (marked by the red dot) are shown below.

Probabilities of precipitation & temperature
A collection, or ensemble, of forecasts are made from different initial conditions several times each day, and the degree to which the ensemble members diverge from each other over time provides information on the likelihood of the future atmospheric state. For New Haven (indicated by the red dot in the above map), the below plot shows how many of the ensemble of 20 forecasts made each morning predict a given amount of precipitation accumulation and maximum surface air temperature. In other words, each line on this plot is a histogramof the predictions made during the time periods noted in the legend. In statistical parlance, this is similar to the probability density function (PDF) for the predictors. For example, if 15 of the forecasts are predicting 10 mm of rainfall between 1-2 days from now, while the remaining 5 forecasts are predicting 15 mm of rainfall, the dark blue line would have a sharp peak at 10 mm/day that tapers off toward zero at 15 mm/day; this would indicate fairly high confidence in a forecast of 10-15 mm/day for that time period (assuming the weather prediction model does not have large errors/bias).


Seasonal rain accumulation
Also just for the city of New Haven, the below plots show the daily rainfall and the total seasonal accumulation of precipitation, compared to the historical average.

North America
Here are forecasts for the North American monsoon, which is most intense on the west coast of Mexico but does extend into the southwestern U.S.
Forecast for wind and precipitation
This animation shows the forecast of precipitation (color shading) and horizontal winds at 850 hPa, which is about 1.5 km above sea level. The precipitation is the accumulation over the previous 6-hour period, in millimeters (1 inch = 25 mm), and winds are measured in m/s (1 m/s = 2.2 miles per hour). This is from a single deterministic forecast. The red box outlines the region over which the total accumulation of rainfall for this season (shown below) is averaged.
All forecast data is from the Global Ensemble Forecast System (GEFS) of the U.S. National Centers for Environmental Prediction (NCEP). All forecasts use an initial atmospheric state at the time indicated on the plot (note that 00Z is midnight Universal Coordinated Time, which is 7 pm the previous day in western Mexico [CDT]).
Seasonal rain accumulation
Also for the main monsoon region (outlined in red on the above map), the below plots show the daily rainfall and the total seasonal accumulation of precipitation, compared to the historical average.

 Monsoon news from Google
- Predictions of normal monsoon boost prospects for domestic agrochem firms - Business Standard
- El Nino Weakening: Above-normal rainfall forecast this monsoon - The Hans India
- Mumbai Airport runways to be shut 6 hours on May 9 for pre-monsoon revamp - Social News XYZ
- Glad tidings on rains - The Financial Express
- Rainfall to be above-normal this monsoon: IMD - DTNEXT
- Monsoon to be 'above normal', predicts IMD - MSN