Home » Blog (Page 3)
Category Archives: Blog
First Forecasts of the Season Released for Indian Monsoon
by Walter Hsiang
With the anticipated arrival of monsoon season in Asia at the start of May, people have a right to be anxious. The annual summer monsoon is the major source of rain in India and much of South Asia, so it has a huge impact on environmental, social, and economic factors in those regions. For example, an overly strong or weak Indian summer monsoon can result in flooding or crop failures. Therefore, accurate monsoon predictions are important for everyone from farmers to politicians so that they may prepare accordingly.

India has an age-old relationship with the monsoon, and very few climate-related events around the globe can compare with the monsoon’s scale and its impact on the economy. The monsoon is estimated to influence 15% of India’s GDP, and the agriculture and energy sectors are most heavily affected. But beyond the economy, the monsoon greatly affects the livelihood of people who live in rural India. These people don’t have access to robust infrastructure and depend on farming for sustenance.
Because the monsoon season bears so much weight, the release of the India Meteorological Department’s long-range forecast (released this past week) has become an annual financial and political event. Private forecasting companies like Skymet have tried to capitalize on this anticipation by releasing their own forecast reports ahead of time.
This year, Skymet has predicted normal monsoon rainfall (102% of the long-term average), while the India Meteorological Department has forecast below-normal rainfall (only 93% of the long-term average). Skymet’s forecast had brought hope to the region, particularly after last year’s deficit monsoon which brought very little rainfall. But if the Meteorological Department is right, the region is in for another dry year — although their forecast of 93% of normal rainfall may not seem that bad, widespread drought characterized the 2012 monsoon which had a total rainfall very near that exact value. And it is good to remember that rainfall can vary regionally within India and temporally throughout the year; unseasonal rains this past February damaged over 27 million acres of farmland in six regions of India.

The Indian economy is really a gamble on the monsoon. Seventy percent of India’s annual rainfall, which irrigates the country’s farmland, comes from the monsoon. The associated weather patterns affect productivity, industrial and agricultural output, health, and energy consumption. When monsoon season does not strike the delicate balance between not-too-much and not-too-little rainfall, it can increase food prices and reduce energy output, which worsens inflation.
Yet India’s reliance in recent years on the monsoon forecasting by the India Meteorological Department (IMD) has also been a gamble. Between 1988 and 2002, the IMD used a 16-parameter statistical prediction model that was claimed to be successful until it crumbled in a 2002 drought. Monsoons have been less predictable since then. The IMD has been working hard on new models that combine statistical and dynamic forecasts, but the average prediction error has only come down by 2% in the last decade. Just last year, the IMD’s prediction of monsoon rainfall was off by nearly 10%. The current forecasts use both a 5-parameter statistical model and an experimental atmosphere-ocean dynamical model.
Despite Skymet’s and IMD’s monsoon prognosis, huge uncertainty remains. It calls into question India’s continued reliance on the monsoon rains, especially with the country’s fast development and modernization. Above all, it outlines a need to develop solutions that reduce India’s vulnerability to unexpected changes in the monsoon.
First Forecasts of the Season Released for Indian Monsoon
by Walter Hsiang
With the anticipated arrival of monsoon season in Asia at the start of May, people have a right to be anxious. The annual summer monsoon is the major source of rain in India and much of South Asia, so it has a huge impact on environmental, social, and economic factors in those regions. For example, an overly strong or weak Indian summer monsoon can result in flooding or crop failures. Therefore, accurate monsoon predictions are important for everyone from farmers to politicians so that they may prepare accordingly.
India has an age-old relationship with the monsoon, and very few climate-related events around the globe can compare with the monsoon’s scale and its impact on the economy. The monsoon is estimated to influence 15% of India’s GDP, and the agriculture and energy sectors are most heavily affected. But beyond the economy, the monsoon greatly affects the livelihood of people who live in rural India. These people don’t have access to robust infrastructure and depend on farming for sustenance.
Because the monsoon season bears so much weight, the release of the India Meteorological Department’s long-range forecast (released this past week) has become an annual financial and political event. Private forecasting companies like Skymet have tried to capitalize on this anticipation by releasing their own forecast reports ahead of time.
This year, Skymet has predicted normal monsoon rainfall (102% of the long-term average), while the India Meteorological Department has forecast below-normal rainfall (only 93% of the long-term average). Skymet’s forecast had brought hope to the region, particularly after last year’s deficit monsoon which brought very little rainfall. But if the Meteorological Department is right, the region is in for another dry year — although their forecast of 93% of normal rainfall may not seem that bad, widespread drought characterized the 2012 monsoon which had a total rainfall very near that exact value. And it is good to remember that rainfall can vary regionally within India and temporally throughout the year; unseasonal rains this past February damaged over 27 million acres of farmland in six regions of India.
The Indian economy is really a gamble on the monsoon. Seventy percent of India’s annual rainfall, which irrigates the country’s farmland, comes from the monsoon. The associated weather patterns affect productivity, industrial and agricultural output, health, and energy consumption. When monsoon season does not strike the delicate balance between not-too-much and not-too-little rainfall, it can increase food prices and reduce energy output, which worsens inflation.
Yet India’s reliance in recent years on the monsoon forecasting by the India Meteorological Department (IMD) has also been a gamble. Between 1988 and 2002, the IMD used a 16-parameter statistical prediction model that was claimed to be successful until it crumbled in a 2002 drought. Monsoons have been less predictable since then. The IMD has been working hard on new models that combine statistical and dynamic forecasts, but the average prediction error has only come down by 2% in the last decade. Just last year, the IMD’s prediction of monsoon rainfall was off by nearly 10%. The current forecasts use both a 5-parameter statistical model and an experimental atmosphere-ocean dynamical model.
Despite Skymet’s and IMD’s monsoon prognosis, huge uncertainty remains. It calls into question India’s continued reliance on the monsoon rains, especially with the country’s fast development and modernization. Above all, it outlines a need to develop solutions that reduce India’s vulnerability to unexpected changes in the monsoon.
Deforestation at high latitudes could impact monsoons
By Julia Rothchild
Russians don’t usually worry about monsoons. But a new study says maybe they should. Research suggests that deforestation in the far north could significantly impact South Asian monsoon rainfall.
The study, published last month in the Proceedings of the National Academy of Sciences, used an idealized climate model to show how cutting down trees at high latitudes might change monsoon circulations.
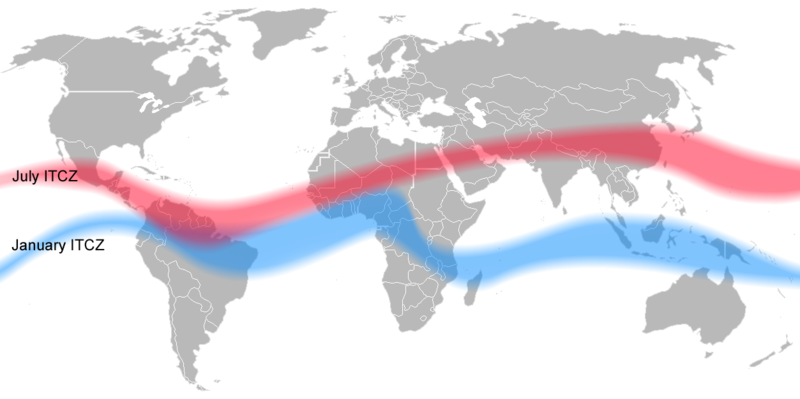
The researchers found that heavy deforestation would shift what is called the Intertropical Convergence Zone (ITCZ) towards the south. The ITCZ is a band of clouds and precipitation circling the globe where the northeast and southeast trade winds converge and rise. It hovers near the equator, but migrates hundreds to thousands of miles north and south of the equator during the course of the seasonal cycle. The ITCZ’s movement determines where and when monsoons occur.
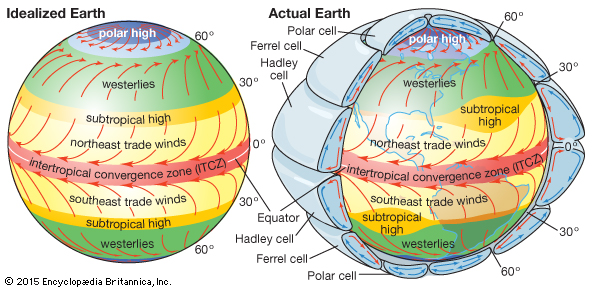
The ITCZ lies north of the equator during June, July, August, and September, when the northern hemisphere’s summer occurs and the warm, rising air lies in the northern hemisphere. During that time, monsoons occur north of the equator. In December, January, February, and March, the ITCZ moves south, and showers the southern hemisphere with monsoon rain during its summer.
Deforestation would push the ITCZ south by providing a remote forcing. Cutting down dark green forests exposes land, and bare land reflects more sunlight than the original forests. In other words, deforestation increases the albedo of the Earth’s surface. The result is less solar absorption, and an energy deficit in the northern hemisphere’s high latitude systems. This causes the ITCZ to shift away from the imposed energy sink.
The idea that the ITCZ might move to the north or south in response to a high-latitude heat source or sink is not new. Numerous studies have shown that an expansion of reflective ice cover in the northern hemisphere would shift the ITCZ southward. It is thought that the decades-long drought in Africa’s Sahel resulted from a southward shift in Africa’s monsoon precipitation, which was caused by temperature changes in the Atlantic Ocean – cooling north of the equator, and warming south of it. These and other studies relating shifts in tropical precipitation to cross-equatorial gradients in energy sources were reviewed here.
A southward shift of the ITCZ would mean that many places in the northern hemisphere that rely on monsoon rains would receive less precipitation. These places include North America, North Africa, and South Asia. In the study’s ideal climate model, northern deforestation causes the rainfall over India in particular to decline by 18%. Correspondingly, the southern hemisphere monsoon regions – South Africa, South America, and Australia – would experience a precipitation increase. It should be noted that the model assumed drastic, major deforestation, in which all trees north of 50 degrees latitude were eliminated and replaced by grasses. But in places that rely on monsoons for life, even a precipitation change of less than 18% would have major impacts on livelihood: droughts and floods plague India when the summer rainfall is only ten percent weaker or stronger than usual.
The study found that far-away deforestation actually has more of an impact on the South Asian monsoon region than does local land surface changes in South Asia. In other words, land changes in India might have less effect on Indian monsoons than deforestation in Russia. We focus on Russia because that particular country has the most forested area of any state on Earth. About 20,000 square kilometers in Russia alone are deforested every year.

The upshot is that people living in India might have less environmental control over the monsoons than people in Russia. This seems not only unintuitive, but politically inconvenient: the people who may be most affected by northern latitude deforestation – Indians, for example – have little say in its occurrence.
The idea that land surface albedo changes might affect monsoons is not new, and it is unclear whether realistic amounts of deforestation would have an appreciable effect on monsoons. Still, this study emphasizes the truly global nature of climate change issues. Maintaining a climate that is healthy for human populations cannot be accomplished by one country alone.
Monsoon rains induce flooding in Jakarta, Indonesia
by Nina Horstmann
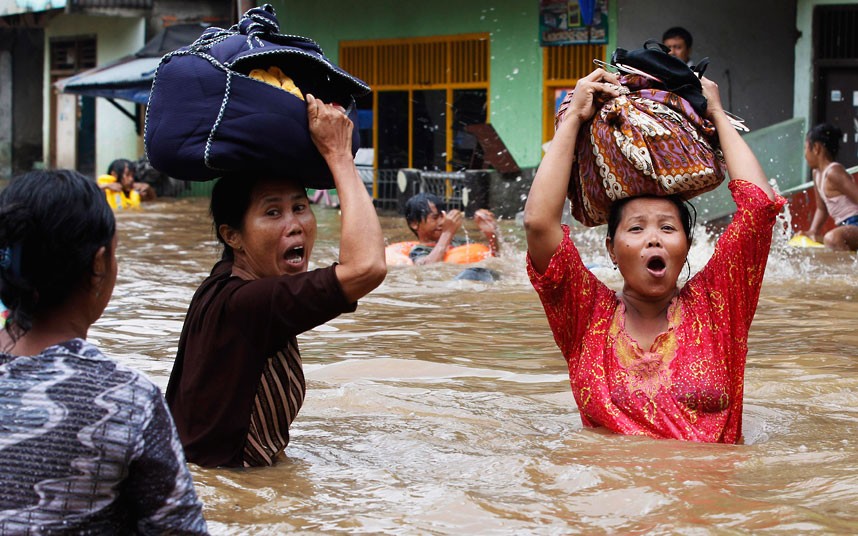
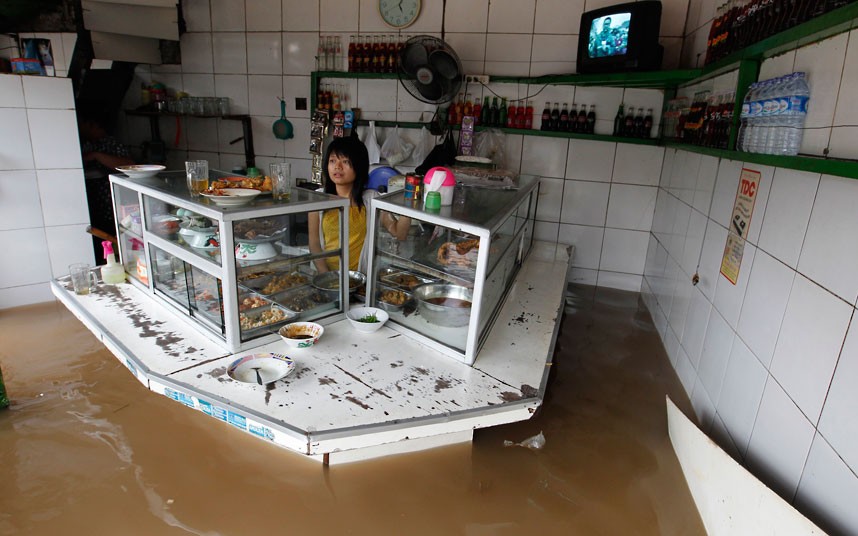
In early February, persistent rains triggered massive flooding in Jakarta, the capital of Indonesia, with floodwaters reaching up to 100 cm. Seasonal monsoon rains and the poor drainage of the low-lying capital city make flooding from late January to mid February an annual event. Other parts of Indonesia, such as the islands of Sumatra and Sulawesi, also experience seasonal flooding and mudslides, but these events are typically most severe in the capital. Around 240 square kilometers of central Jakarta lie below sea level, and flooding can become acute when heavy rain and high tides coincide.
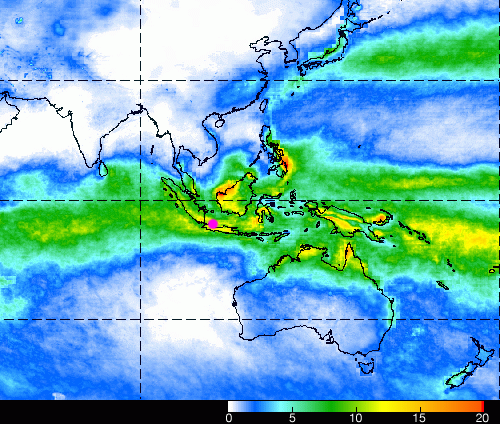
Indonesia experiences extreme variations in rainfall between its wet and dry seasons because of the seasonal shifts in winds that constitute monsoons. Jakarta lies about six degrees of latitude south of the equator, and so receives the most rain in January, when the warmest, wettest air rises just south of the equator in the summer hemisphere. In fact, the island of Java, which is home to Jakarta, is right in the center of the Indian Ocean’s intertropical convergence zone – the near-equatorial band of precipitation that stretches around the planet.
The annual nature of the monsoon and related flooding in Jakarta complicates disaster response. In contrast to abrupt events such as a typhoon or tsunami, annual flooding is anticipated and gradual. Because of its expectedness, annual flooding enters the realm of the ordinary and does not prompt swift action or response. However, the Indonesian government still has not created a comprehensive system for addressing massive flooding, which annually brings the city of Jakarta to a standstill. Yayat Supriatna, a public infrastructure analyst, commented in The Jakarta Post that, “The city administration has to run faster by repairing the poor drainage system to allow a smooth flow of rainwater to all rivers; and also the pump houses, so that floodwater can be pumped out to the sea rapidly.” Because of the dense population of the Jakarta metropolitan area (according to the Central Bureau of Statistics, approx. 28 million in 2010), these annual flooding events affect millions of citizens.
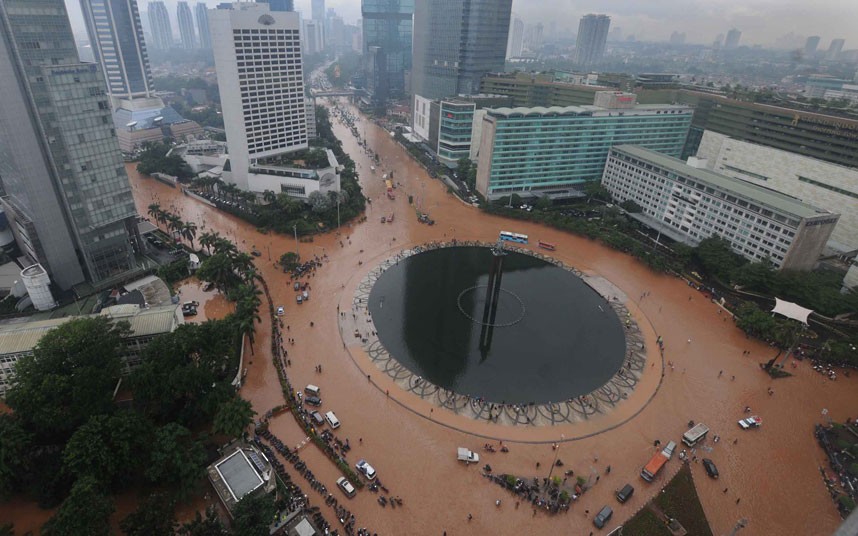
Yearly, flooding disrupts transit and business activity, displaces thousands of residents, creates economic damage, and results in dozens of fatalities. Importantly, because the imbalance between precipitation and surface evaporation is expected to increase as climate warms, flooding might worsen in future decades. In 2013, Jakarta experienced an extreme year; a river burst its banks and flooding engulfed the Central Business District, resulting in hundreds of millions of dollars in property damage. In 2007, the human impacts of annual flooding were particularly dire, when 80 people were killed and an additional 200,000 were displaced due to severe flooding.
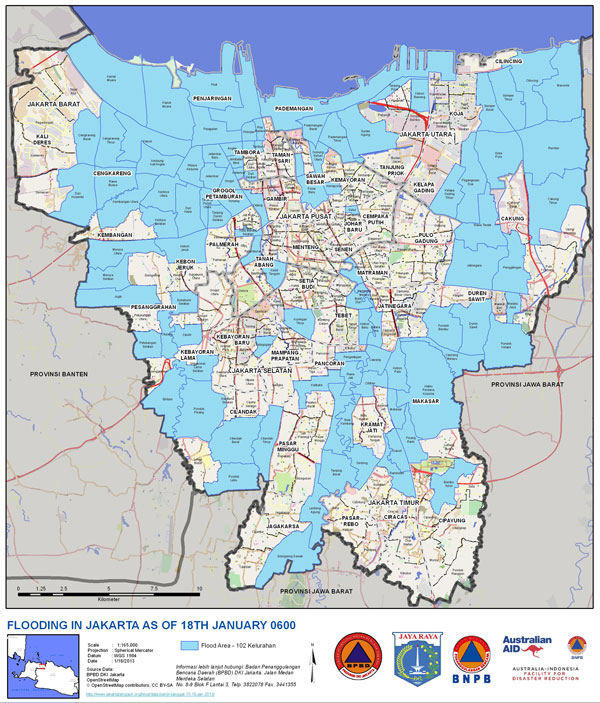
In order to prepare citizens and inform them of the extent of seasonal flooding, the Indonesian government is turning to the Internet and social media to disseminate forecast information. On its website, the Indonesian Agency for Meteorology, Climatology, and Geophysics (BMKG) provides a daily weather forecast as well as a map displaying the flood potential for different parts of the city. Additionally, the Natural Disaster Mitigation Agency (BPBD) and the Traffic Management Center of the Jakarta Police Department are using Twitter to release regular information of flood conditions in the city. A new website, PetaJakarta.org, also draws on the Twitter platform, using crowdsourcing to aggregate and map flood-related tweets.
PetaJakarta is an initiative run by BPBD and the SMART Infrastructure Facility at the University of Wollongong in Australia. The project reported that on February 9, a day which experienced massive flooding, their map pulled in around 800 flood-related tweets per hour and more than 12,000 users logged onto their site that day. The PetaJakarta mapping initiative allows BPBD to receive real-time reports, expediting their response to emergencies, and enables citizens to monitor flooding and traffic levels in their neighborhoods. Social media and Internet resources offer exciting new opportunities to disseminate advance forecasts and real-time weather and traffic conditions. This model could perhaps be extrapolated to other megacities in the tropics that are affected by monsoons and flooding.
Drought in São Paulo: Causes and Effects
By Julia Rothchild
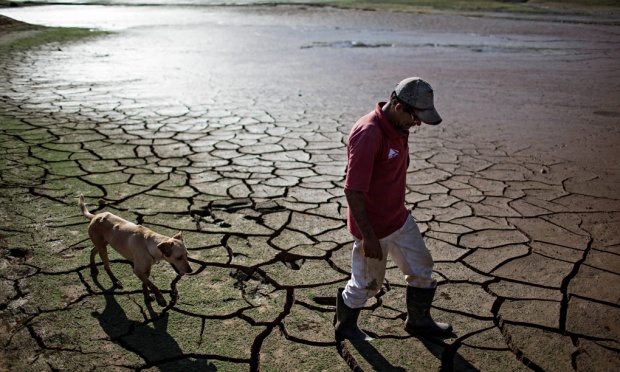
About a year ago in the Bolivian Amazon, floodwaters washed away the homes and property of 150,000 people. But right now, just 1500 miles away, inhabitants of São Paulo are experiencing the worst drought in decades. Last week, residents drilled through their own basement floors, hoping to find groundwater available for drinking. The city’s main water utility has lowered the water pressure in pipes so that people use less.

The causes of these two recent South American weather extremes may be connected. Some meteorologists have argued that the flood and the drought could be explained by a meteorological phenomenon in which the usual migration of high- and low-pressure systems is disrupted. This is called “atmospheric blocking,” and usually happens when a high-pressure system stops moving across the globe and hovers in the mid-latitudes. Because it is stuck in one place, the system blocks the normal travel of weather systems from west to east.
The floods may have been caused when winds, forced to rotate around a stationary system, brought moisture-laden air into the Bolivian Amazon. The same process may have led to the drought in São Paulo, as winds carrying precipitation haven’t been able to reach the area. That means there’s almost no water in the air over that part of Brazil, and therefore little rain.
The map below shows how much atmospheric pressure has deviated from the norm over the past six months. The culprit – a high-pressure area shaded in red – hovers just southeast of Brazil. This “block” of air drives normal wind patterns into a meteorological traffic jam, in which some air becomes stuck where it shouldn’t be. Wind flowing counter-clockwise skirts around the edges of this high, and brings dry air from outside the tropics into South America.
(As an aside, it is interesting to note that the dark purple shading over northeastern Canada indicates that there is a low-pressure system there. The very cold winter in the eastern U.S. this year is associated with this northern hemisphere low. Air flows counter-clockwise around this area, bringing cold arctic air into central and eastern North America.)
Scientists attribute the recent Bolivian flood and Brazilian drought to a single event of atmospheric blocking, as opposed to the wider trend of man-made climate change. But some think that what is considered an anomaly now could become commonplace if the world’s temperatures keep rising.
The current São Paulo drought is ravaging the city. Nine million people rely on the Cantareira reservoir system, which is currently only 5% full. Another three million usually receive water from the Alto Tietê reservoir network, which is less than 15% full. The government has proposed rationing water, so that every week residents of São Paulo have two days with water and five days without.
Inhabitants of São Paulo have responded to governmental water restrictions by hoarding the water they can find in containers. These buckets and watering cans are often left open outside, and as such, they have become ideal places for mosquitoes to breed. In a seemingly paradoxical twist, the drought has created a haven for mosquitoes that thrive in wet conditions.
This is a huge problem because many mosquitoes in the region carry dengue fever, which causes high fever and muscle convulsions. The incidence of disease is up 163% from last year. In some parts of the São Paulo state, the figure is worse, and officials are calling this an epidemic.
The Brazilian water crisis is a result of uncontrollable weather patterns, but is exacerbated by a failure of resource management. Environmental advocates have attempted to put an end to practices that pollute areas of water production. But according to some, the Brazilian government heavily supports efforts to expand exports of soya, beef, and pig iron and focuses less on environmental issues. These industries are the cause of much of the deforestation and greenhouse gas emission in the country, which may lead to even worse droughts in the future.
How monsoons drive life in the Western Ghats
By Julia Rothchild
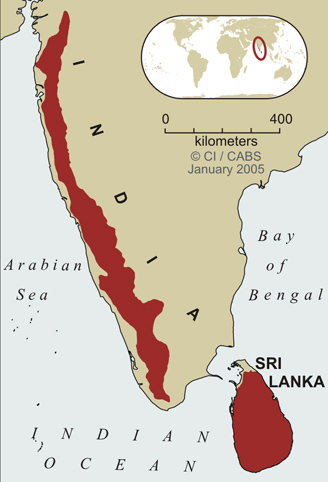
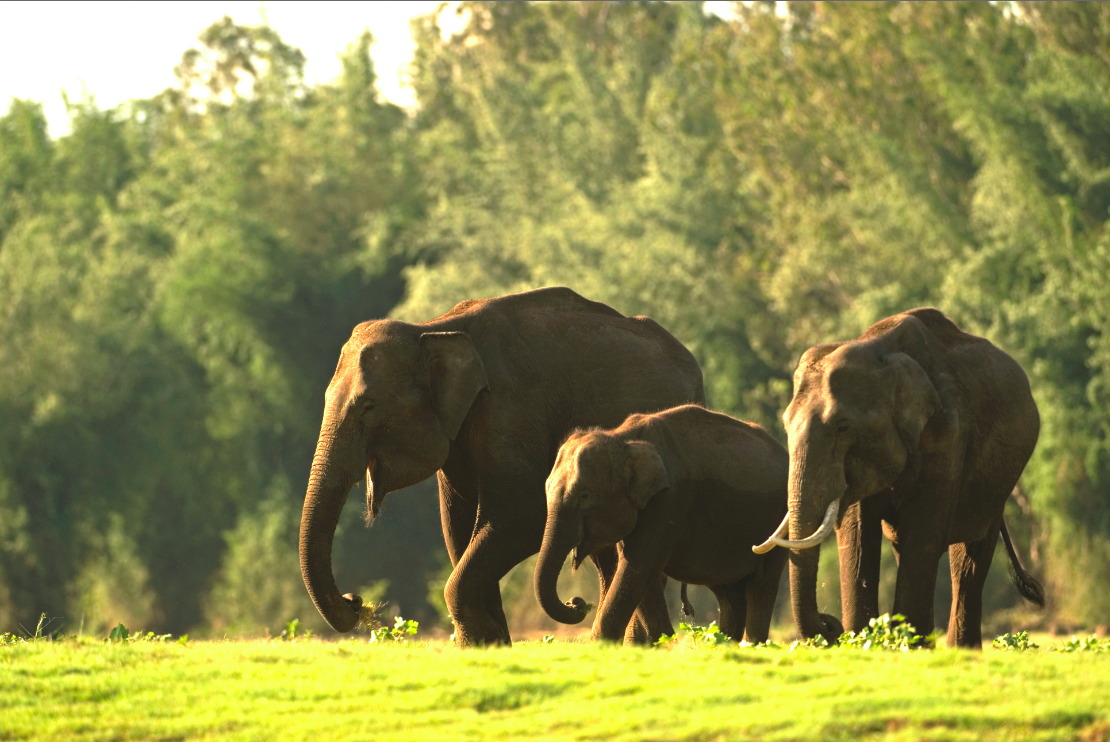
In the mountains of southern India, the grass really is greener on the other side. The Western Ghats, a mountain range that runs for 1,600 kilometers along the western coast, support much more plant and animal life on one side than the other. The ecological contrast is due in part to the heavy rains that sweep over the country for several months every year.
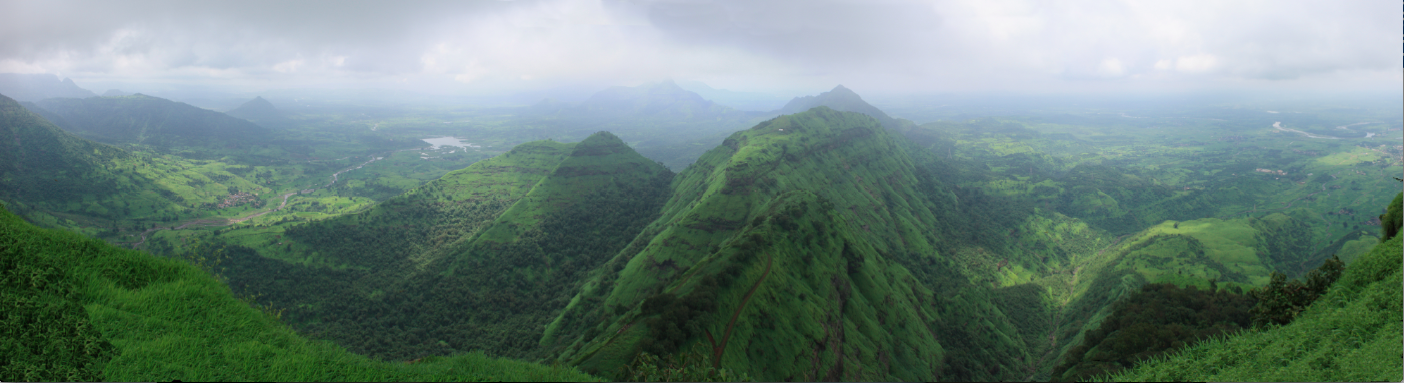
During monsoon season, the side of the Western Ghats mountain range that faces the Arabian Sea is covered in dense deciduous and evergreen forests. The earth blooms with thousands of species of flowering plants. The macaque, Asian elephant, purple frog, and crimson-backed sunbird all find a home among the verdure. The rivers and lakes are full.
The other side of the Western Ghats – the side that faces most of the Indian peninsula – is parched by comparison. Brown savannas cover the earth. The diversity of flora and fauna is more limited.
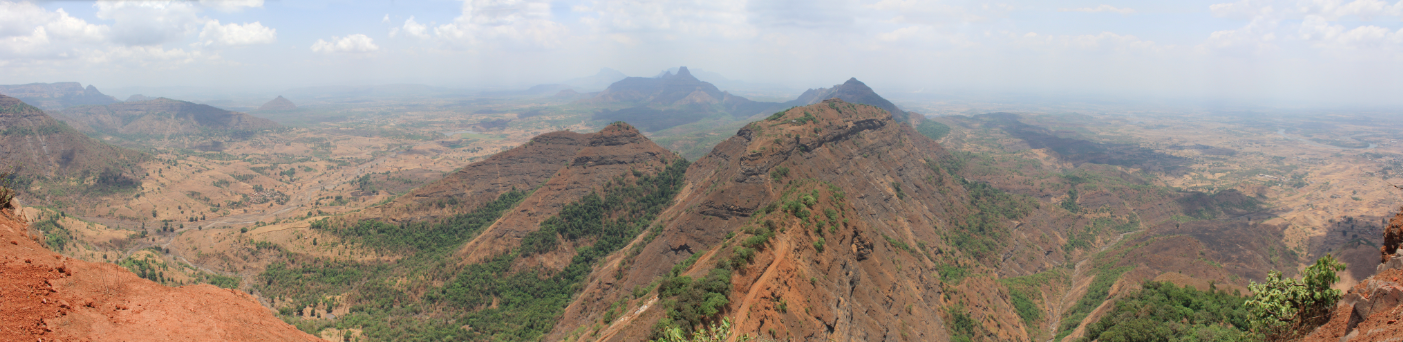
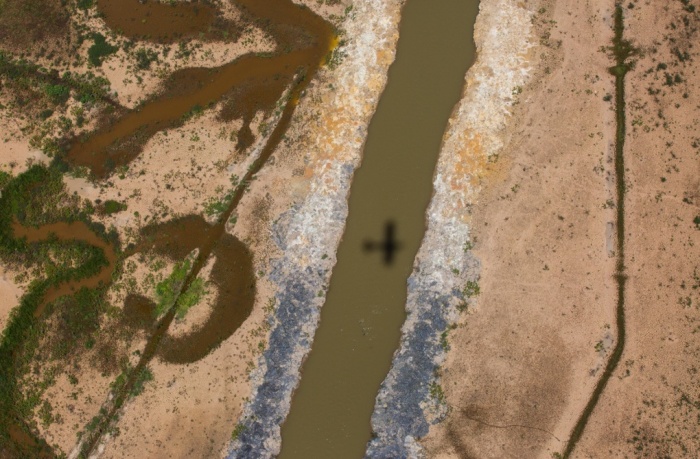
This natural disparity – more pronounced in some areas than in others – arises because of the way monsoons make their way towards the mainland at the end of every spring. Air near Earth’s surface flows northward from the winter hemisphere toward the Asian land mass that is heated by the summer sun. The Coriolis force turns this air to the right to become the low-level “monsoon westerlies” – eastward winds that constitute the lower branch of the monsoon circulation. These winds are laden with moisture, and travel across the Arabian Sea towards India. About 40 kilometers inland, the air is confronted with the massive chain of mountains, which act as a tall barricade. In order to cross the mountain range, like any good hiker, the monsoon air must trudge up and over. While the air climbs the slopes, much of its moisture falls as rain. When it reaches the other side, the air has been depleted of moisture, which means the climate is more arid east of the peaks.
Due in large part to the huge amount of rainfall on their windward side, the Ghats are one of the world’s eight “hottest hotspots” of biological diversity. Around 5,000 species of vascular plants alone grow there, as do hundreds of species of mammals, reptiles, birds, and amphibians. A large number of these species are endemic to the Ghats: they are found nowhere else in the world. The monsoons therefore nourish an exceptionally vibrant pocket of life. They enable a hotspot of biodiversity, saturated with water, to thrive.

But when the clouds are less generous, both on the drier side of the mountains and during the dry winter months, both wildlife and human life suffer. Drier air means fewer crops and, depending on the area, perhaps less business or more hunger.
Within the past month, it has been reported that farmers in the state of Maharashtra, of which Mumbai is the capitol, are suffering severely from a drought. Sixty percent of villages are currently facing “drought-like conditions,” and the state and Central government are attempting to find relief and aid money. This is the fourth drought in the state since 2008, and agricultural production in the area may be cut in half.
Is there a way to help farmers in areas prone to droughts? To predict anomalies in the Western Ghats, modeling monsoon behavior is critical. Current models are imperfect because of the number and complexity of factors involved. These factors include the starting temperatures of sea air and land air, the contour of the mountains, the size and depth of clouds, and the microscopic interactions between water droplets in the air. The enormous range of variables gives us some idea of the vast challenge climate scientists face when attempting to predict the outcome of the upcoming monsoon season in southern India. As research finds more effective methods to model each of these processes, we hope that predictions of how monsoon air behaves in any given season will improve, and with them the lives of people living in the shadow of the Western Ghats.
Tropical-midlatitude-topographic interactions in Hudhud
(written Oct. 12) Tropical cyclone Hudhud is heading into a storm: a vigorous midlatitude upper-level trough approaching from the west.
In Figure 1, Hudhud is over India while the trough is a kink in the black 200 hPa height contours and the associated ball of cyclonic vorticity (red). They are forecast to “collide” Oct 14th over the Himalayan foothills.
Cumulative rain in the 0.5-degree GFS forecast (Fig. 2) reaches almost 200mm in western Nepal — comparable to amounts seen in the developing winter monsoon in Malaysia, Sumatra, and (to a lesser extent) Vietnam. The initially sharp trough seems to be blunted with time. But locally, valley by valley, there could be more. And the model could be wrong of course.
(Meanwhile, Japan will be under formidable typhoon Vongfong, also interacting with a broader trough in the westerly jet stream)
Animations of Fig. 1 can be seen at http://weather.rsmas.miami.edu/repository/alias/MiamiMonsoonLoops
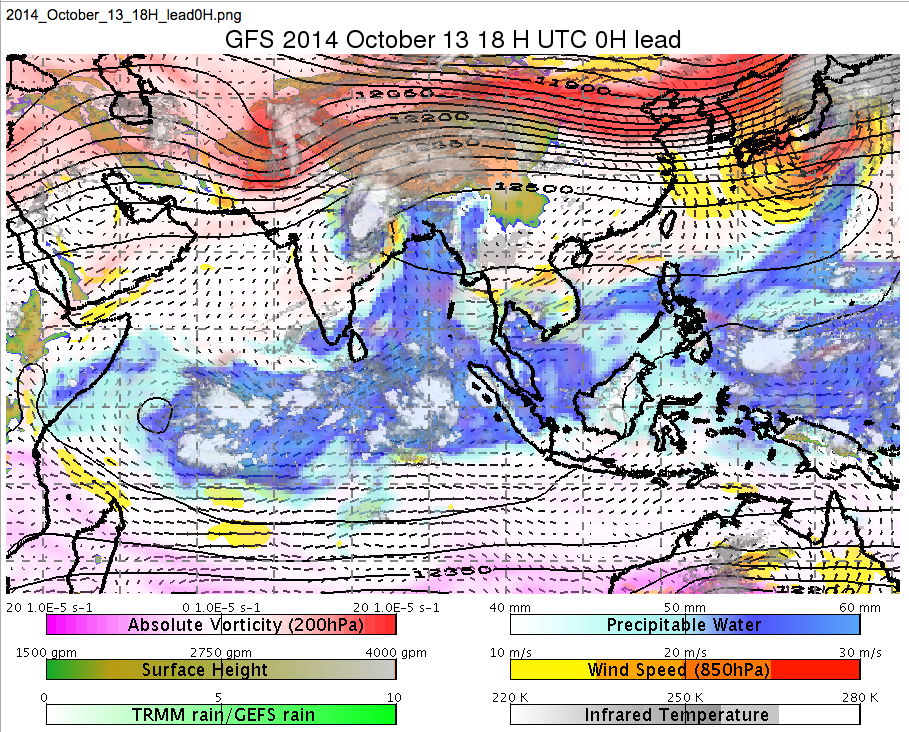
- Fig. 1. The GFS-analyzed situation (plus IR satellite cloudiness) at 18 UTC on Oct. 13 as tropical cyclone Hudhud approaches a strong midlatitude trough over northern India.

- Figure 2: Cumulative rainfall (mm) during Hudhud’s demise, in the GFS 0.5 degree forecast. Vectors at 850 hPa and height contours at 250 hPa are also shown.
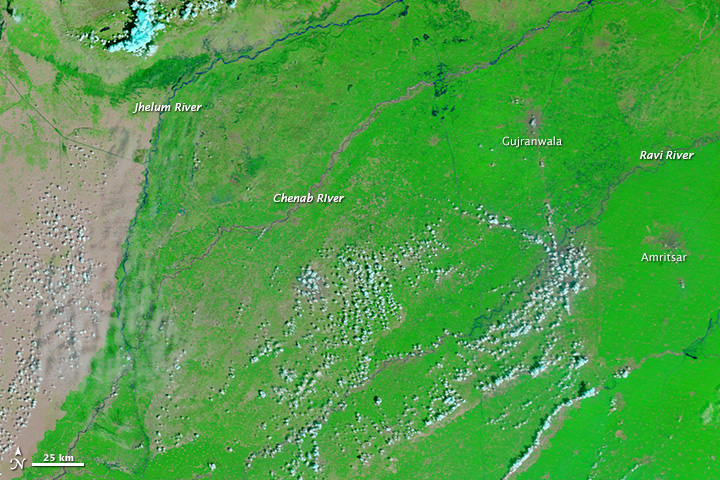
Floods kill hundreds in Kashmir
From September 3 – 7, about 12 inches of rain fell in the India-Pakistan region of Kashmir. The resulting flooding has resulted in a death toll of at least 200, and well over 100,000 people were rescued by the military. NASA’s Terra satellite shows the dramatic expansion of the region’s rivers between August 31 and September 11 to 10 km-wide channels stretching for hundreds of kilometers:
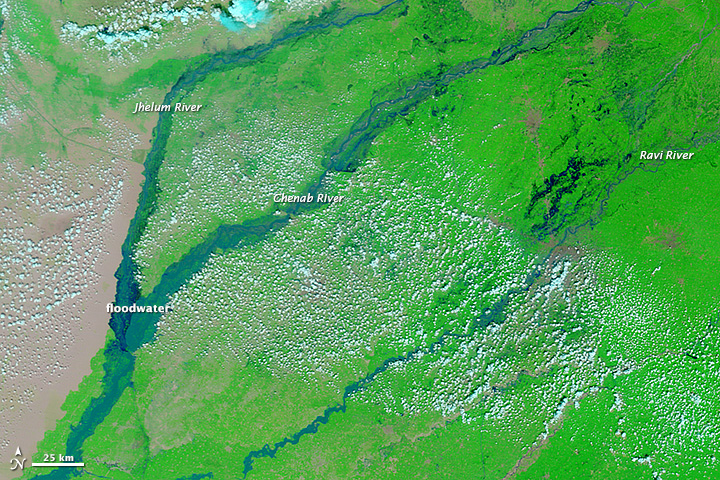
This torrential rainfall was produced by a monsoon depression — a type of storm that is substantially weaker than a typhoon but can pass over land without loss of intensity. An average of 5 or 6 monsoon depressions form every year in the Indian region, with most originating over the ocean east of India and then propagating to the northwest. This particular one seems to be fairly intense (animation compiled from images obtained from Yoshi Kajikawa’s monsoon site at the University of Hawaii):
There is some discussion of this monsoon depression interacting with an eastward-propagating midlatitude disturbance, thereby producing the extreme rainfall observed in the region. Further analysis is needed to understand the meteorology of this event, why it produced such unusually strong rainfall in what has this season been an otherwise fairly dry region, and how often similar extreme events should be expected in the future.
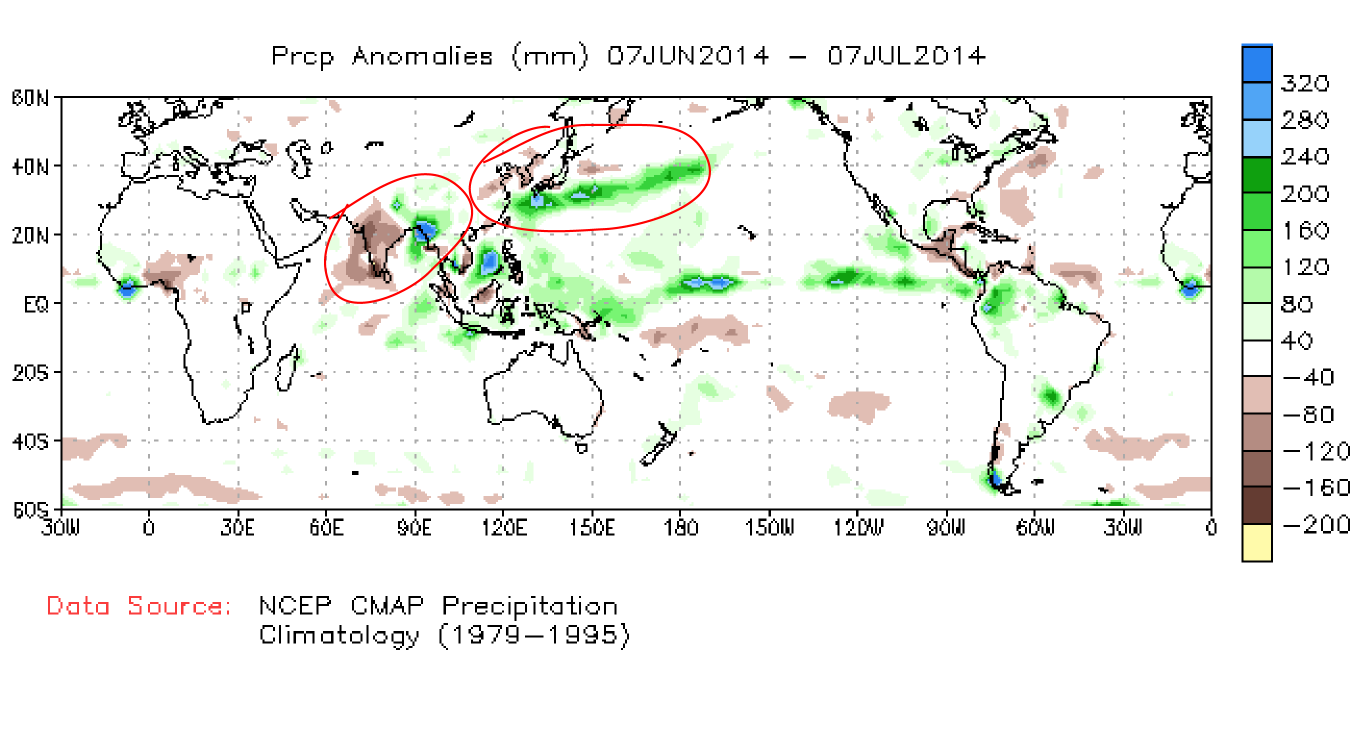
The lesser-known monsoon droughts
India tends to dominate the monsoon-related news this time of year, despite the fact that there are multiple other monsoon regions that may be experiencing hydrological events that are just as extreme. This year is a case in point: about 80% of the recent links in a Google news search on “monsoon” relate to India and Nepal, in particular to the floods and landslides that killed at least 50 people there. The other 20% refers mostly to the North American monsoon, in particular to the U.S. portion. (Note that the recent precipitation events in India, though deadly, are part of several rainy episodes occurring since mid-July that have brought India as a whole up from 40% below normal precipitation to “only” 17% below normal.)
Our point is that there are fairly severe droughts in other world monsoon regions that have gotten comparatively little attention. Equatorial Africa and South America are currently experiencing dry anomalies even stronger than the one in India. That can be seen on our website here, as well as in this map of precipitation anomalies in the last 6 months:
Rainfall is particularly below normal in Venezuela, but it is interesting that this was predicted and seemingly planned for to some degree. Back in early June the Venezuelan government predicted half the normal precipitation for the 2014 rainy season because of the effects of the developing El Nino. Perhaps this can be viewed as a successful prediction, even though that El Nino event has thus far proven to be weak, at best. Nevertheless, there is still suffering, with news articles reporting reduced crop planting and elevated cattle mortality in the severe drought. News coverage of this, though, is fairly scant.
We also mentioned that equatorial Africa has less rain than usual, especially parts of Nigeria, Cameroon, and the Congo. But it is difficult to find reports of widespread severe drought in those regions via the usual web searches, and the Famine Early Warning System Network (FEWS NET) is not reporting agricultural drought there. So one wonders if this below-average rainfall is just not that much of a stress because the average rainfall is so high, or if there is perhaps some error in some of the gauge-based rainfall dataset that we have been using, or if news agencies simply haven’t picked up on local conditions.
Finally, the drought in at least some of the Korean peninsula seems to have been lessened by, unfortunately, torrential rains that have led to floods. These floods have led to deaths, displacements, and destruction of farmland and residences.
These were just a few words to bring attention to some of the hydrological extremes happening in monsoon regions outside of India. Over time we hope to build a collection of links to other websites that provide real-time updates on tropical weather events and their impacts; we don’t currently know of any single site that does this, but suggestions are very welcome.
Are the Korean and Indian droughts caused by warm oceans?
The precipitation anomalies that began this summer’s monsoon season have mostly persisted: a large dry anomaly over central and northern India and a band of dryness over northeast coastal China and the Korean peninsula. These can be seen in maps of anomalous precipitation over the past 30 days:
These dry anomalies seem to be predominantly part of a spatial shift in the normal maximum, from India toward the east over Bangladesh and Myanmar, and from the Korean peninsula toward the south. Although India does not seem to be in a formal “drought” yet, there are widespread reports of impacts from high temperatures and dryness over much of the region, with some large-scale economic effects. North Korea does seem to be in a severe drought state, with media reporting the driest conditions in over a decade and deleterious effects on agriculture.
What has caused these dry conditions? Is the dryness in Korea and India related, or is it just a coincidence that the normal rainfall maximum have shifted eastward over South Asia and southward over East Asia? While it is not possible to answer these questions definitively without much more detailed investigation than I can do on a blog, it is intriguing that sea surface temperatures (SSTs) are warmer than usual over the tropical West Pacific:

In the above map of SST anomalies for the past month, you can see warm anomalies in the equatorial East Pacific associated with what might be the development of an El Nino event, as well as warm anomalies of about 1 K in the West Pacific. Perhaps the warm West Pacific is essentially causing an eastward shift of the South Asian rainfall maximum and a southward shift of the East Asian maximum. The latter is organized in what is called the Maiyu-Baiu front, an east-west band of precipitation that stretches from China to the east of Japan, and this band seems to be shifted south of its normal position so that it now lies more over the cold SST anomalies just south of Japan. So an auxiliary question is: are the cold SSTs a response to the cloudiness of the shifted Maiyu-Baiu front, or is the front responding to the SST anomalies? There has been some research into connections between this front and SST, although I am not very familiar with this and there seem to be many open questions. Or perhaps the cause of the Asian rainfall anomalies is the warm SST in the equatorial East Pacific, or something altogether different from SST.
It will be interesting to see if some of these precipitation anomalies continue, especially if we head further toward an El Nino state. Current predictions from the Indian Institute of Tropical Meteorology are for enhanced monsoon rainfall over central and northern India in the coming week or so, with the west part of India remaining dry for the next two weeks. The U.S. forecast model (NCEP’s GFS) is also predicting above-normal rain over central India over the next week, but continued dryness over N. and S. Korea:
Let’s check back in a week or two to see what has happened with Indian and Korean drought.
 Monsoon news from Google
- Airborne observations of Asian monsoon sees ozone-depleting substances lofting into the stratosphere - Phys.org
- Jinkx Monsoon and Cole Escola on the Business of Being Funny - vmagazine.com
- Monsoons launch ozone-depleting substances into the stratosphere - Earth.com
- Things to do in Goa in monsoon to make the most out of your trip - Business Insider India
- WASA seeks funds before monsoon - The Express Tribune
- Pre Monsoon Rain-Thundershower Over Punjab, Haryana, Chandigarh, Delhi, Rajasthan, Madhya Pradesh: Hailstorm ... - Skymet Weather