Better tracking of tropical vortices
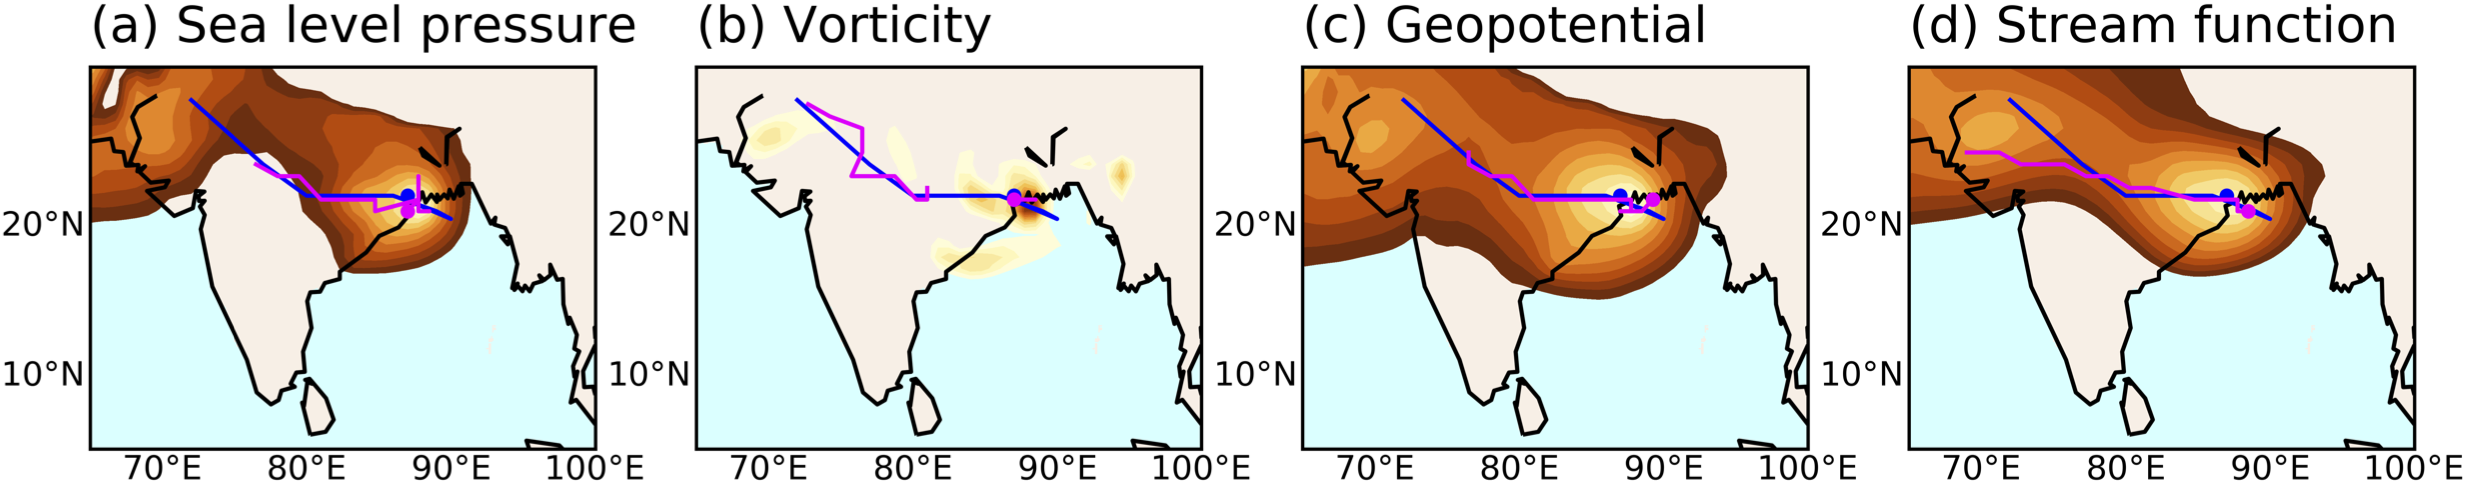
Tropical vortices are often identified using sea level pressure or lower-tropospheric vorticity. For strong vortices such as typhoons, algorithms based on these variables can easily provide an unambiguous vortex track. However, for dynamically weaker vortices such as monsoon lows and monsoon depressions, which can produce intense rainfall despite their weak winds, tracking algorithms based on these variables can often fail. This occurs because these systems typically have peak intensity several kilometers above the surface, so that surface pressure is a poor indicator of the dynamics happening at that altitude; vorticity, even when measured at the altitude of maximum wind, is a highly noisy variable that often cannot capture the smooth evolution of the broader circulation of these storms.
We developed a methodology based on the lower-tropospheric streamfunction of the horizontal wind. This captures the full rotational flow, like vorticity, but has the smoothness of pressure or geopotential height (while, unlike those variables, not making any assumption about the geostrophic nature of the flow). We track streamfunction extrema using the TempestExtremes algorithm, a computationally efficient Lagrangian feature tracker developed at the University of California Davis that can operate on the native grid of high-resolution forecast models. We optimized the criteria used in tracking to best match a hand-analyzed track dataset of monsoon lows and depressions. For more details, see our paper: Vishnu et al. 2020
Details on our analyses
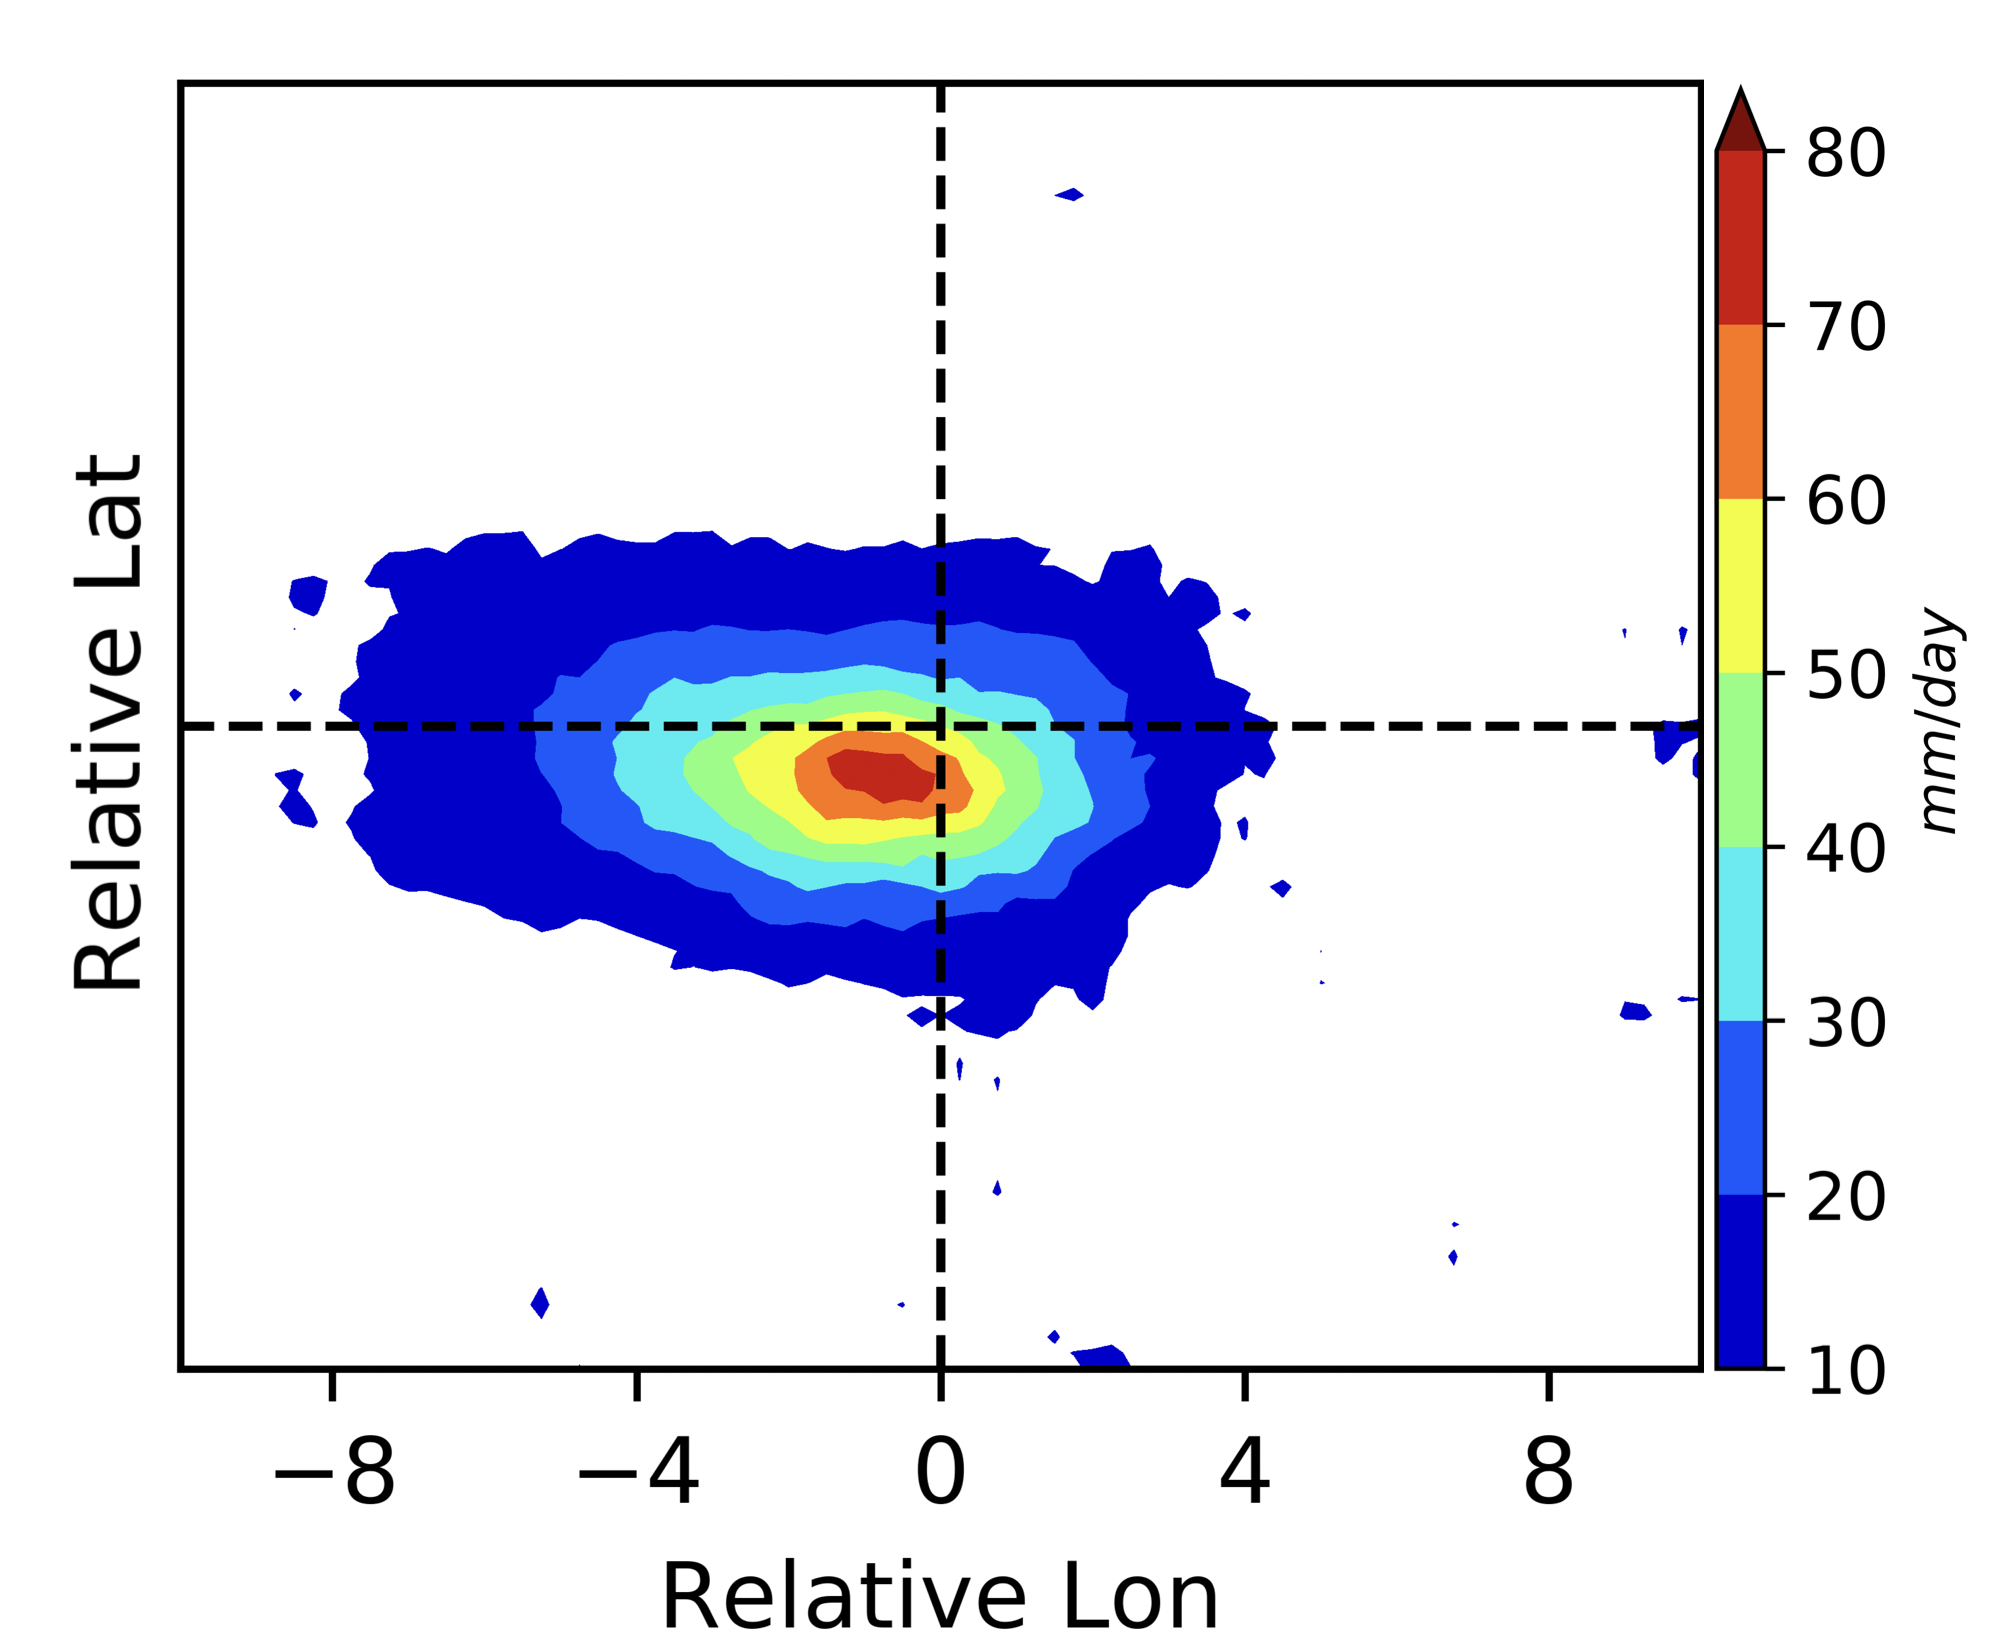
- In the map of along track rainfall, rain is accumulated over the entire 10-day forecast period within 3 degrees of the vortex center (as identified by our tracking algorithm operating on the 850 hPa streamfunction). This typically provides a view of the most intense precipitation falling near or just southwest of the storm center.
- For all time series, averages and maxima are evaluated within 8 degrees of the vortex center. This provides a broader indication of all convective activity and wind within the broader circulation of the storm.
- The pressure drop is the difference in sea level pressure between the center and periphery of the storm, and provides one measure of storm intensity. The maximum surface wind is another intensity measure.
- The 72 hour accumulated rainfall is simply a map of all precipitation falling within the first 72 hours of the forecast. When vortices form after this 72-hour period, they are not plotted on this map.

Our sponsors
This project was sponsored by the Monsoon Mission of India's Ministry of Earth Sciences, with close cooperation of the Indian Institute for Tropical Meteorology (IITM). The project was led by S. Vishnu, Suhas D.L., and William Boos at UC Berkeley, and by Sahadat Sarkar and Parthasarathi Mukhopadhyay at IITM. Paul Ullrich at UC Davis developed and supported use of the TempestExtremes code base.