Home » Articles posted by William Boos (Page 2)
Author Archives: William Boos
West Africa
Here are forecasts for the West African monsoon, which brings rain to the vast region of the Sahel just south of the Sahara desert.
Forecast for wind and precipitation
This animation shows the forecast of precipitation (color shading) and horizontal winds at 850 hPa, which is about 1.5 km above sea level. The precipitation is the accumulation over the previous 6-hour period, in millimeters (1 inch = 25 mm), and winds are measured in m/s (1 m/s = 2.2 miles per hour). This is from a single deterministic forecast. The red box outlines the region over which the total accumulation of rainfall for this season (shown below) is averaged.
All forecast data is from the Global Ensemble Forecast System (GEFS) of the U.S. National Centers for Environmental Prediction (NCEP). All forecasts use an initial atmospheric state at the time indicated on the plot (note that 00Z is midnight Universal Coordinated Time, which is 1 am in central Africa or 8 pm the previous day in New York [EDT]).
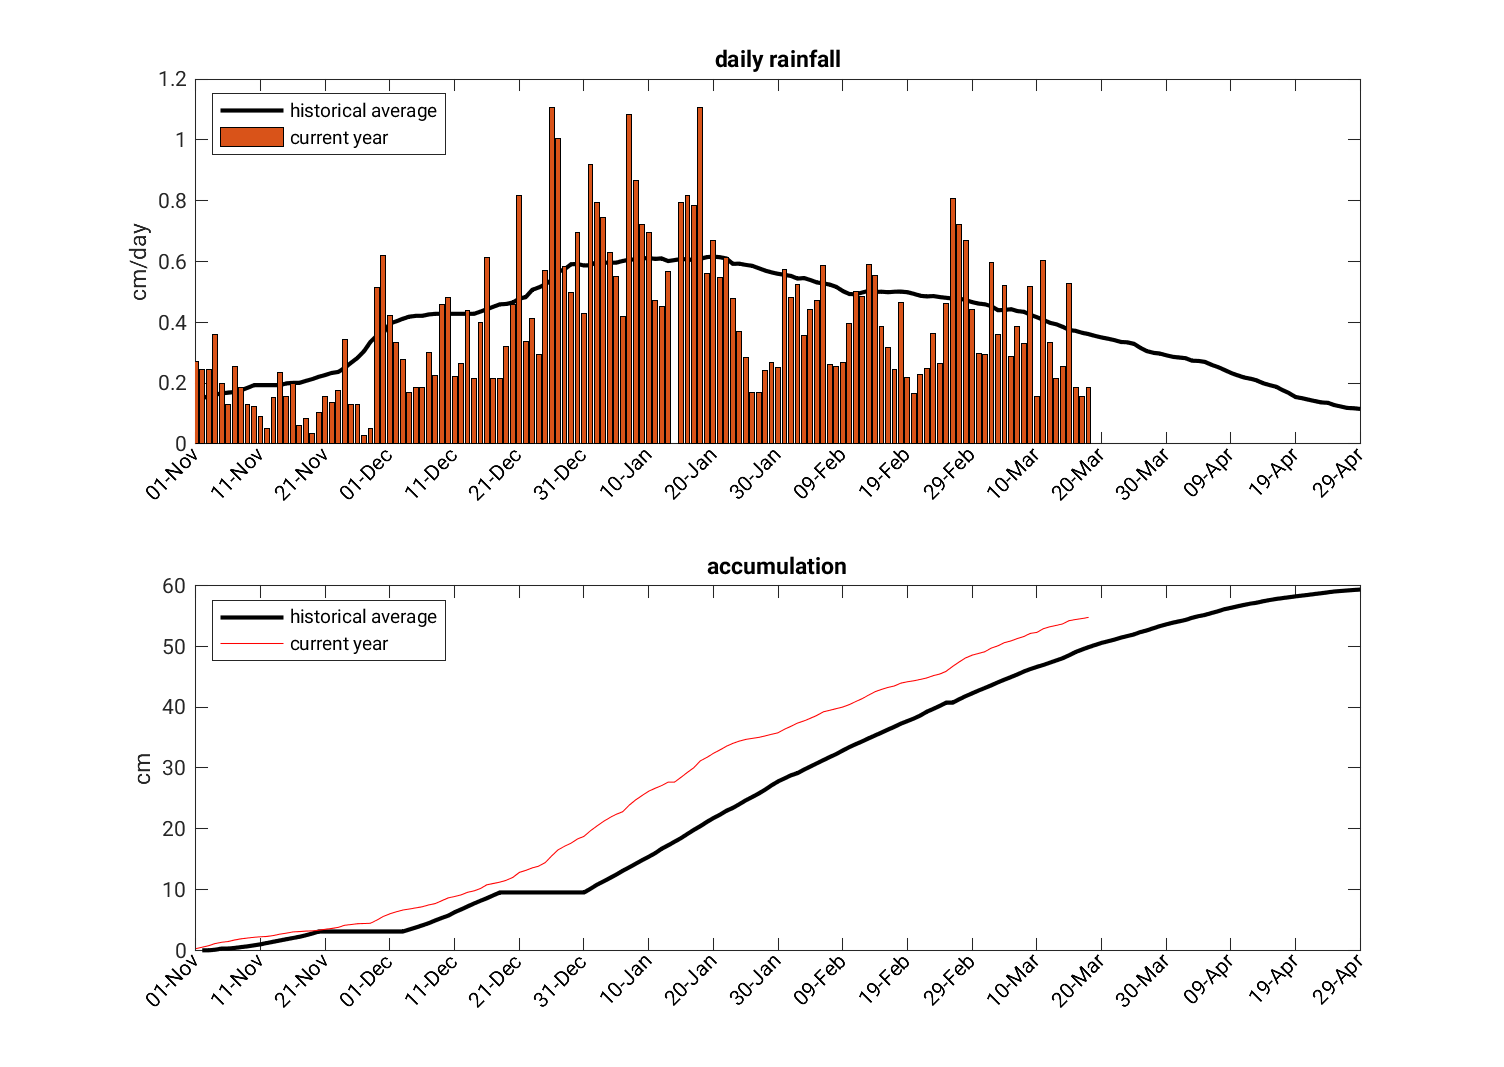
Seasonal rain accumulation
Also for the Sahel (red box in the above map), the below plots show the daily rainfall and the total seasonal accumulation of precipitation, compared to the historical average.
South Asia
Here are forecasts and rain accumulations for South Asia, which is home to the strongest monsoon on the planet.
Forecast for wind and precipitation
This animation shows the forecast of precipitation (color shading) and horizontal winds at 850 hPa, which is about 1.5 km above sea level. The precipitation is the accumulation over the previous 6-hour period, in millimeters (1 inch = 25 mm), and winds are measured in m/s (1 m/s = 2.2 miles per hour). This is from a single deterministic forecast. The red box outlines the region over which the total accumulation of rainfall for this season (shown below) is averaged.

All forecast data is from the Global Ensemble Forecast System (GEFS) of the U.S. National Centers for Environmental Prediction (NCEP). All forecasts use an initial atmospheric state at the time indicated on the plot (note that 00Z is midnight Universal Coordinated Time, which is 5:30 am in India or 8 pm the previous day in New York [EDT]).
Seasonal accumulation
The below plots show the daily rainfall and the total seasonal accumulation of precipitation, compared to the historical average, all averaged over the red box in the map above.

Global forecasts
Below are forecasts for the precipitation accumulation and maximum surface air temperature achieved during each of the next 3 days. These are deterministic forecasts, meaning a single forecast is issued based on the best guess of the current state of the atmosphere (without any consideration for our uncertainty about that state). All forecasts are direct output from the U.S. Global Forecasting System (GFS) model, and were initialized today at the time indicated below.
Day 1 forecast


Day 2 forecast


Day 3 forecast


Forecasts
Here you’ll find several types of forecasts:
- global, deterministic forecasts for the next 3 days
- probabilistic forecasts for several sites for the next 5 days:
- Kolkata (the Indian monsoon)
- Cameroon (the West African monsoon)
- Puerto Vallarta (the North American monsoon)
- New Haven, Connecticut, USA (far from any monsoon region, but the physical home of this website)
Today’s weather
Here are estimates of tropical weather in the past 24 hours:
Precipitation, estimated by satellite
(the Tropical Rainfall Measuring Mission [TRMM] Real-time Multi-Satellite Precipitation Analysis [TMPA-RT], version 7)

Surface air temperature
(temperature 2 meters above the surface averaged over a period of 24 hours, from the NCEP operational analysis)

Surface wind speeds
(from the NCEP operational analysis; units are m/s, with 1 m/s equal to 2.2 miles/hour or 3.6 km/hour)

Intertropical Convergence Zone
Seasonal shifts of the intertropical convergence zone (ITCZ)
About Monsoons
text
Cameroon Farm
Here are forecasts and rain accumulations for a point near Kumbo, Cameroon at 6.26°N, 10.95°E.
Forecast for wind and precipitation
This animation shows the forecast of precipitation (color shading) and horizontal winds about 1.5 km above sea level. The precipitation is the accumulation over the previous 6-hour period, in millimeters (1 inch = 25 mm), and winds are measured in m/s (1 m/s = 2.2 miles per hour). This is from a single deterministic forecast.
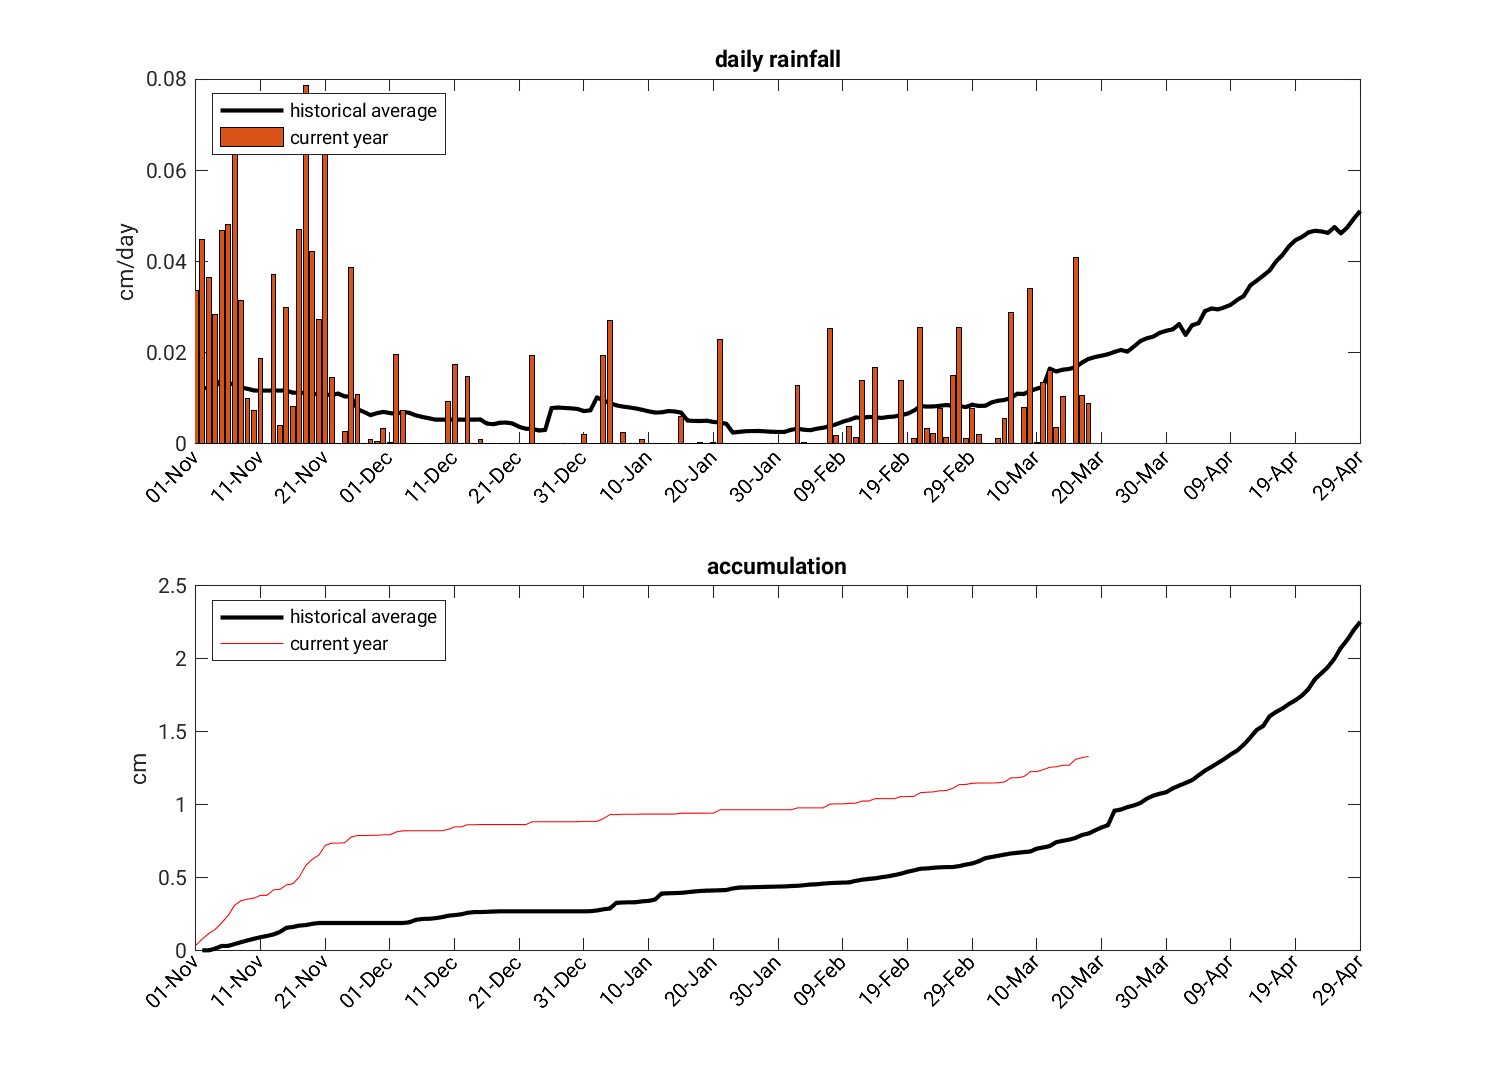
Seasonal rain accumulation
The below plots show the daily rainfall and the total seasonal accumulation of precipitation, compared to the historical average, for our point of interest (shown by the red star in the above map).
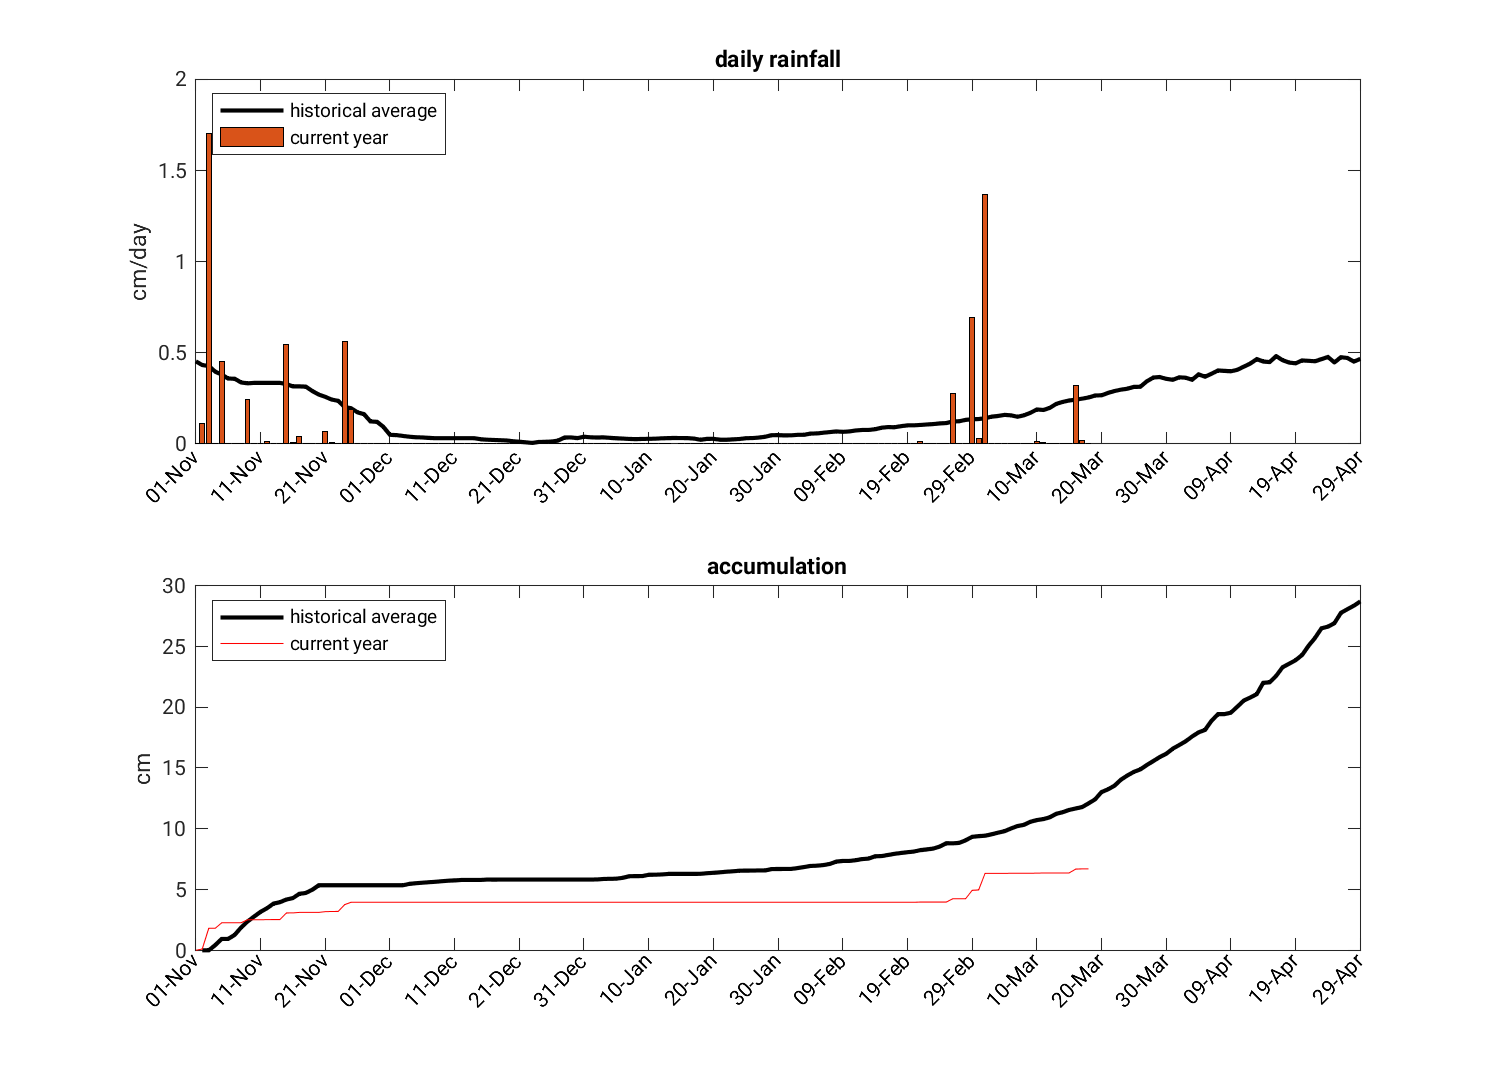
All forecast data is from the Global Ensemble Forecast System (GEFS) of the U.S. National Centers for Environmental Prediction (NCEP). All forecasts use an initial atmospheric state at the time indicated on the plot (note that 00Z is midnight Universal Coordinated Time, which is 1 am in central Africa or 8 pm the previous day in New York [EDT]).
Latest updates from the Famine Early Warning Systems Network
FEWS NET was created by USAID in 1985 to help with advance planning for possible humanitarian crises. They do not have staff in Cameroon, but monitor it from a neighboring country. Be sure to look at their latest updates on Cameroon, (always click through to “Read More” at the bottom), and also view their analyses of agriculture supply and price trends.
Southern African monsoon
While the African monsoon that is most widely known lies north of the equator and takes place during the northern hemisphere’s summer, a monsoonal circulation does exist over the southern part of the continent during the southern hemisphere’s summer. The precipitation maximum during this season stretches from Angola on the west coast of southern Africa all the way to Madagascar.
Forecast for wind and precipitation
This animation shows the forecast of precipitation (color shading) and horizontal winds at 850 hPa, which is about 1.5 km above sea level. The precipitation is the accumulation over the previous 6-hour period, in millimeters (1 inch = 25 mm), and winds are measured in m/s (1 m/s = 2.2 miles per hour). This is from a single deterministic forecast. The red box outlines the region over which the total accumulation of rainfall for this season (shown below) is averaged.

All forecast data is from the Global Ensemble Forecast System (GEFS) of the U.S. National Centers for Environmental Prediction (NCEP). All forecasts use an initial atmospheric state at the time indicated on the plot (note that 00Z is midnight Universal Coordinated Time, which is 2 am in central Africa [e.g. Johannesburg] or 7 pm in New York [EDT]).
Seasonal accumulation
The below plots show the daily rainfall and the total seasonal accumulation of precipitation for southern Africa (averaged over the red box shown above), compared to the historical average.
 Monsoon news from Google
- India's Good Monsoon Forecast Is A Relief, But There's A Much Deeper Problem - NDTV
- The many ways monsoon affects your life - The Times of India
- Pre-monsoon sanitation drive in Kerala faces hurdles due to polls, extreme heat - The New Indian Express
- Signs of change in rural economy - MSN
- BBMP launches two-week cleaning campaign ahead of monsoon, elections - Deccan Herald
- Nand Lal, Mohan Lal Brakta accuse BJP of deserting people during monsoon disaster - The Tribune India