Home » Forecasts
Category Archives: Forecasts
South American monsoon
The maximum precipitation moves from the northern end of South America in the Southern Hemisphere’s winter to the central Amazon river basin in the Southern Hemisphere’s summer (November – March). That is monsoon season in South America and brings rainfall to much of the Amazon rainforest.
Forecast for wind and precipitation
This animation shows the forecast of precipitation (color shading) and horizontal winds at 850 hPa, which is about 1.5 km above sea level. The precipitation is the accumulation over the previous 6-hour period, in millimeters (1 inch = 25 mm), and winds are measured in m/s (1 m/s = 2.2 miles per hour). This is from a single deterministic forecast. The red box outlines the region over which the total accumulation of rainfall for this season (shown below) is averaged.
All forecast data is from the Global Ensemble Forecast System (GEFS) of the U.S. National Centers for Environmental Prediction (NCEP). All forecasts use an initial atmospheric state at the time indicated on the plot (note that 00Z is midnight Universal Coordinated Time, which is 8 pm the previous day in central Brazil (Manaus), Australia or 7 pm in New York [EDT]).
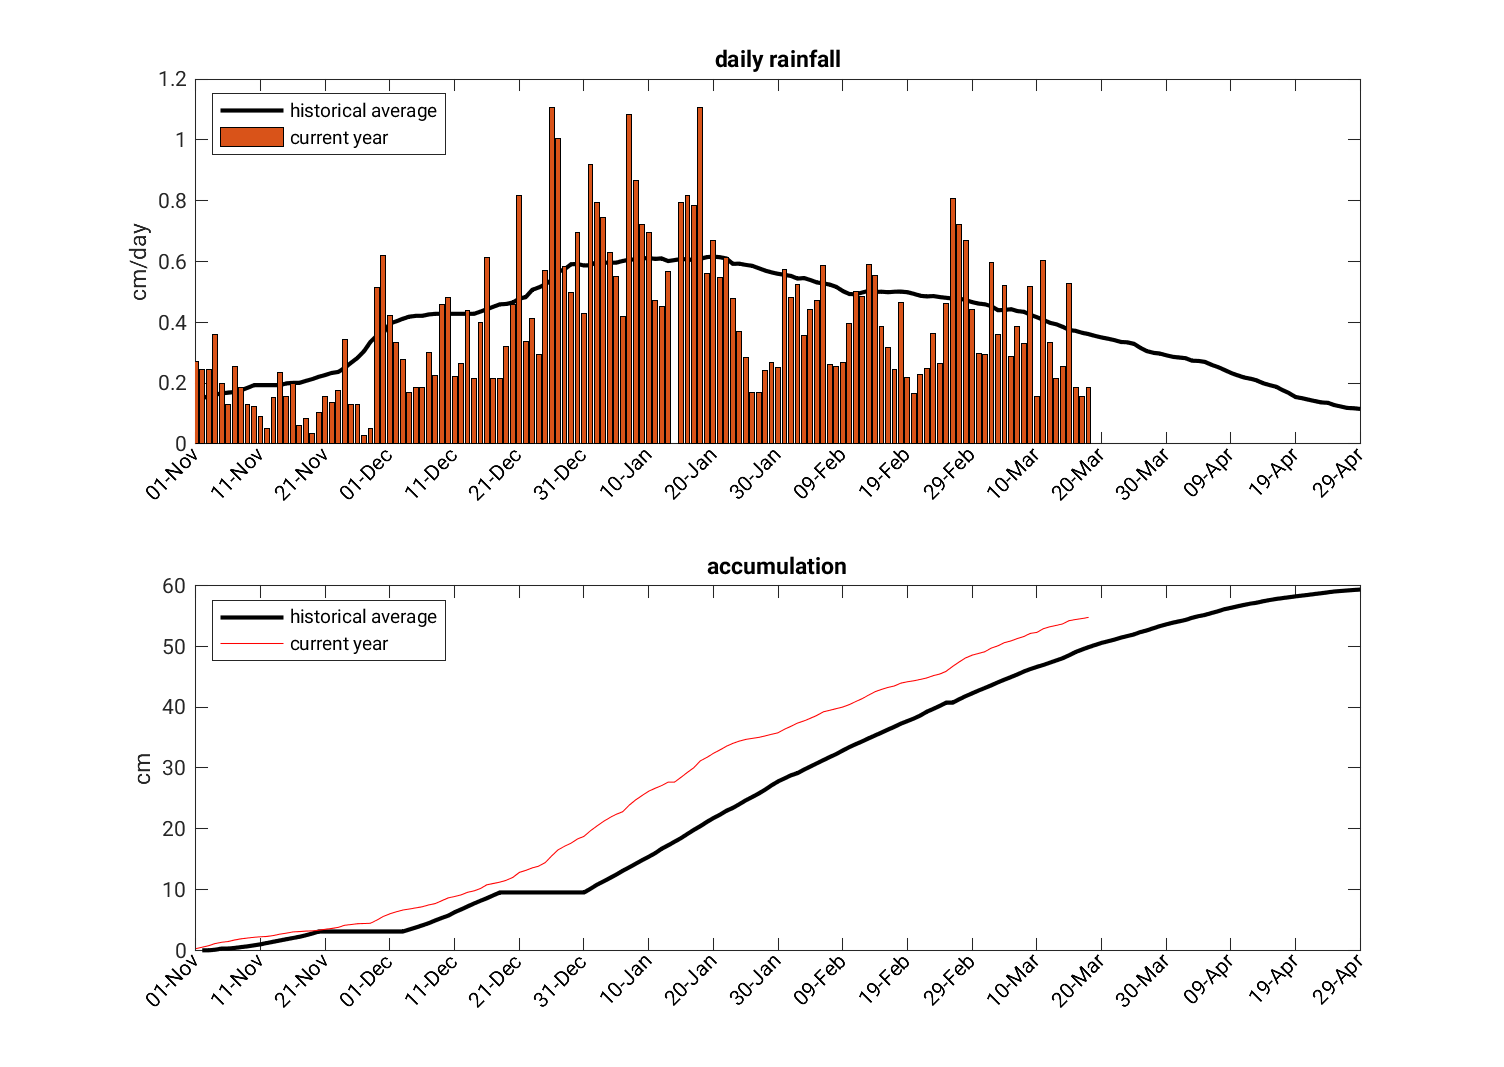
Seasonal accumulation
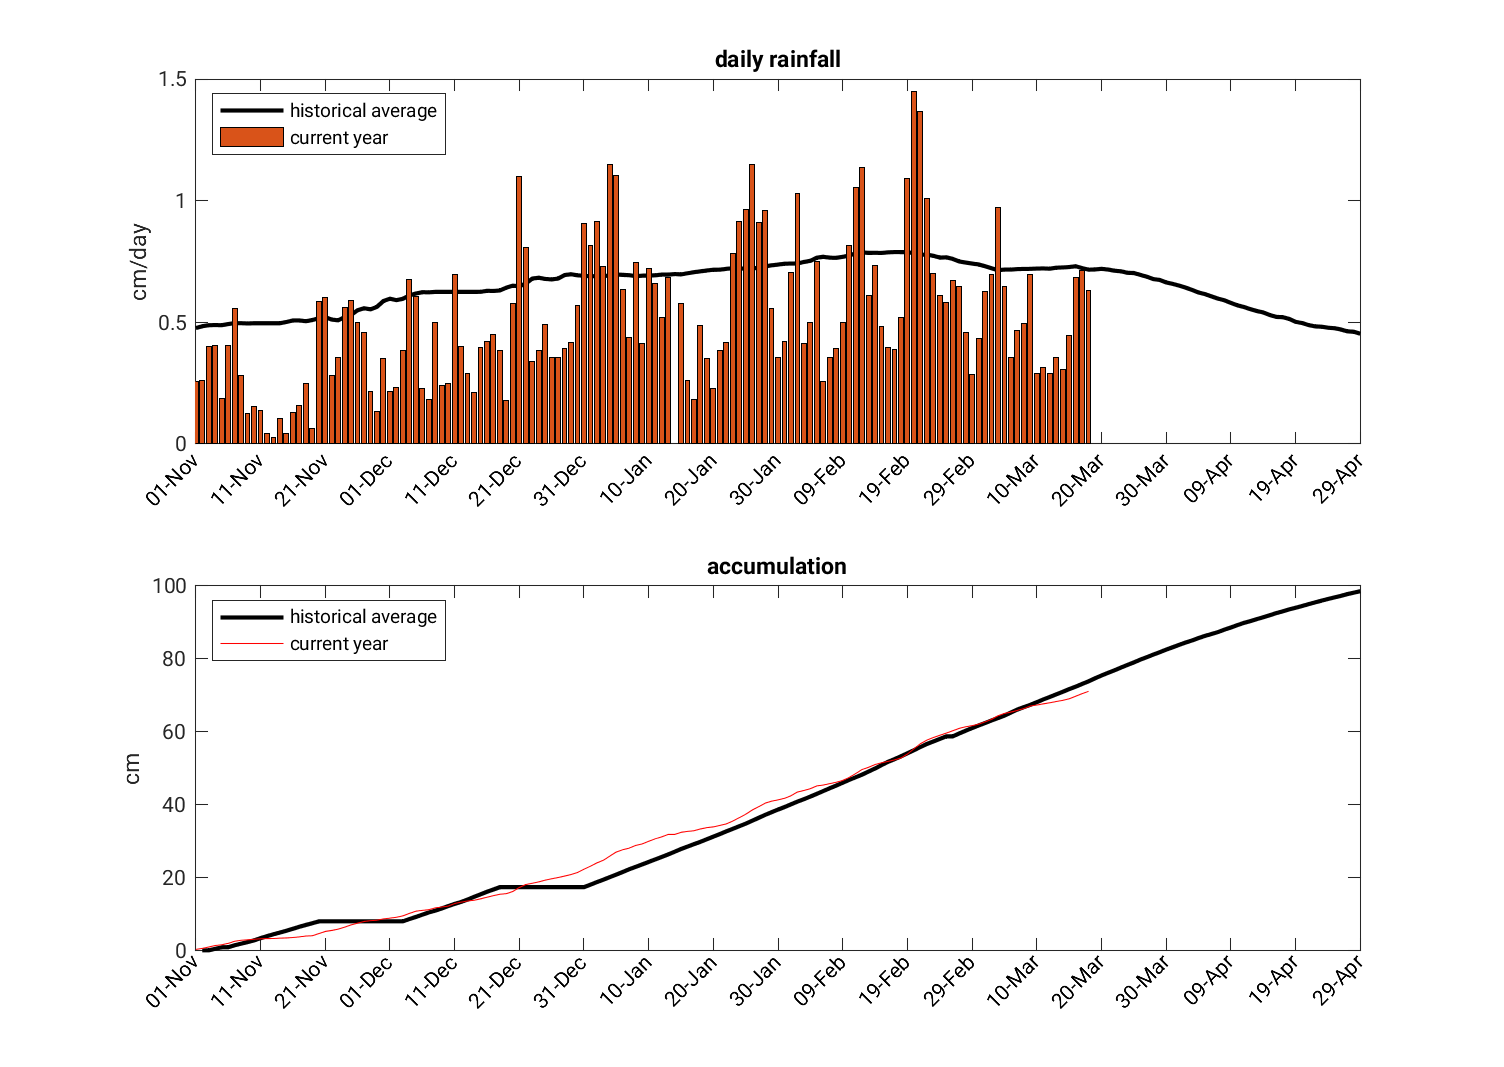
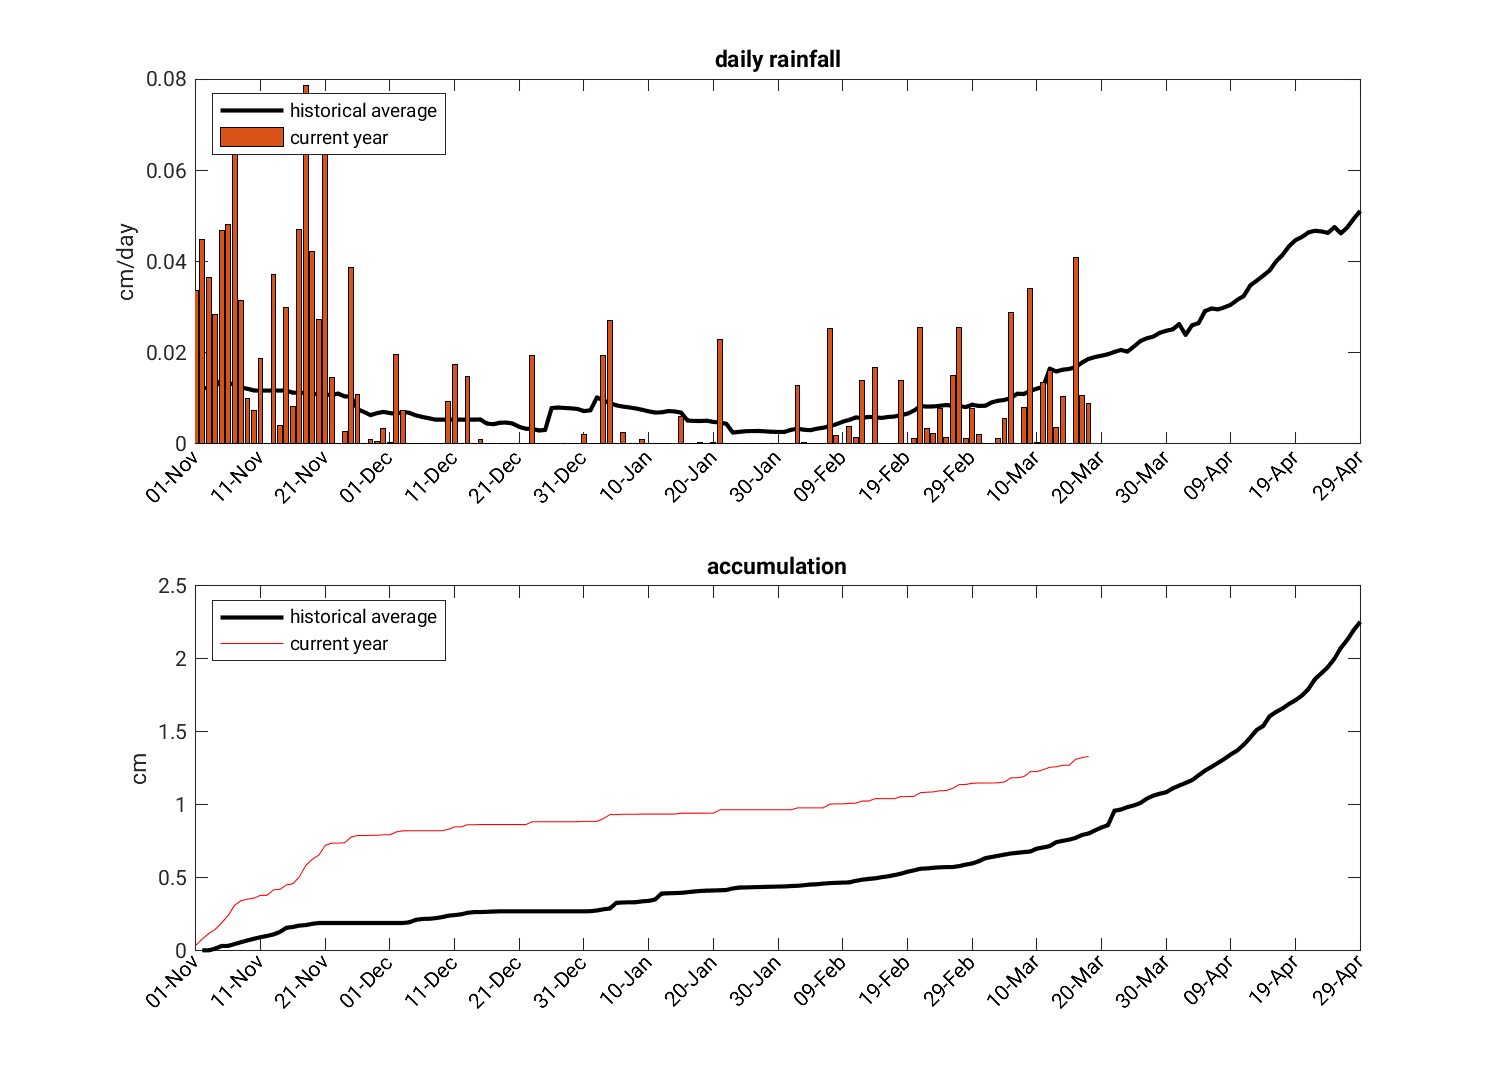
The below plots show the daily rainfall and the total seasonal accumulation of precipitation for central South America (70-40W, 16-2S), compared to the historical average.
Australian monsoon
The northern end of Australia receives most of its precipitation during its summer monsoon season, which typically occurs during December – March.
Forecast for wind and precipitation
This animation shows the forecast of precipitation (color shading) and horizontal winds at 850 hPa, which is about 1.5 km above sea level. The precipitation is the accumulation over the previous 6-hour period, in millimeters (1 inch = 25 mm), and winds are measured in m/s (1 m/s = 2.2 miles per hour). This is from a single deterministic forecast.
All forecast data is from the Global Ensemble Forecast System (GEFS) of the U.S. National Centers for Environmental Prediction (NCEP). All forecasts use an initial atmospheric state at the time indicated on the plot (note that 00Z is midnight Universal Coordinated Time, which is 9:30 am in Darwin, Australia or 8 pm the previous day in New York [EDT]).
Seasonal accumulation
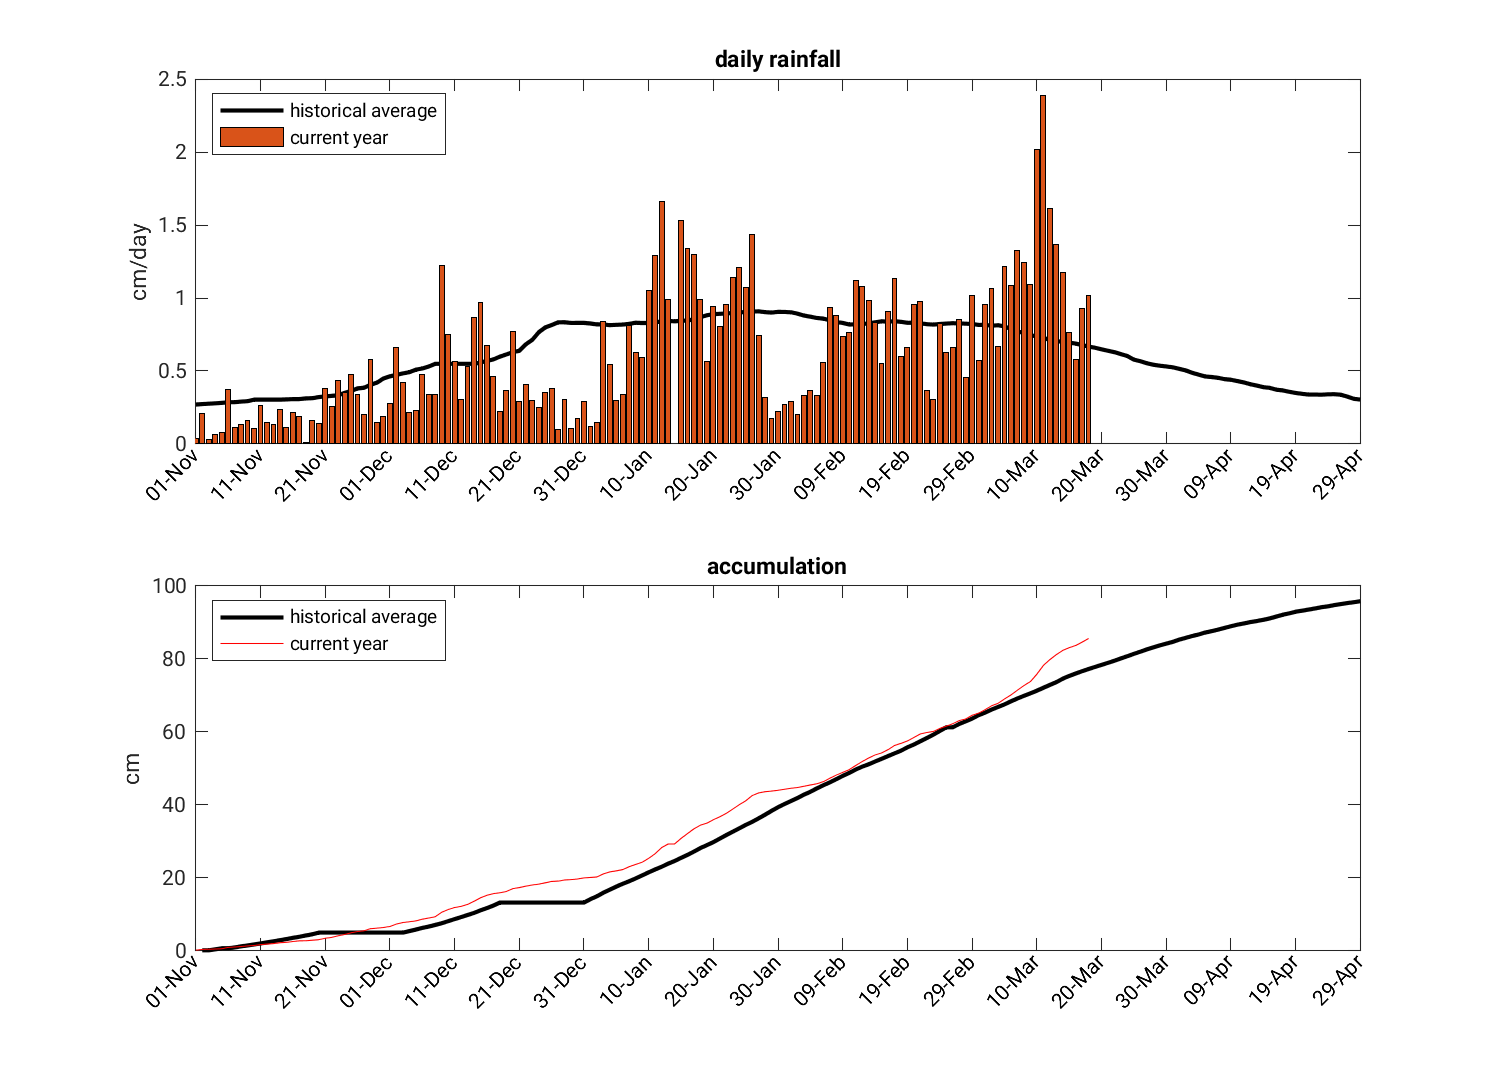
The below plots show the daily rainfall and the total seasonal accumulation of precipitation for the “top end” of Australia (120-146E, 20-5S), compared to the historical average.
Northeastern U.S. (with additional details for New Haven)
The northeastern U.S. is far from any monsoon region, but forecasts for this region are shown because it is home to Yale University, which hosts this website. We show additional details for New Haven, Connecticut.
All forecast data is from the Global Ensemble Forecast System (GEFS) of the U.S. National Centers for Environmental Prediction (NCEP). All forecasts use an initial atmospheric state at the time indicated on the plot (note that 00Z is midnight Universal Coordinated Time, which is 8 pm the previous day in New Haven [EDT]).
Forecast for wind and precipitation
This animation shows the forecast of precipitation (color shading) and horizontal winds at 850 hPa, which is about 1.5 km above sea level. The precipitation is the accumulation over the previous 6-hour period, in millimeters (1 inch = 25 mm), and winds are measured in m/s (1 m/s = 2.2 miles per hour). This is from a single deterministic forecast; the ensemble, probabilistic forecast for New Haven (marked by the red dot) are shown below.

Probabilities of precipitation & temperature
A collection, or ensemble, of forecasts are made from different initial conditions several times each day, and the degree to which the ensemble members diverge from each other over time provides information on the likelihood of the future atmospheric state. For New Haven (indicated by the red dot in the above map), the below plot shows how many of the ensemble of 20 forecasts made each morning predict a given amount of precipitation accumulation and maximum surface air temperature. In other words, each line on this plot is a histogramof the predictions made during the time periods noted in the legend. In statistical parlance, this is similar to the probability density function (PDF) for the predictors. For example, if 15 of the forecasts are predicting 10 mm of rainfall between 1-2 days from now, while the remaining 5 forecasts are predicting 15 mm of rainfall, the dark blue line would have a sharp peak at 10 mm/day that tapers off toward zero at 15 mm/day; this would indicate fairly high confidence in a forecast of 10-15 mm/day for that time period (assuming the weather prediction model does not have large errors/bias).


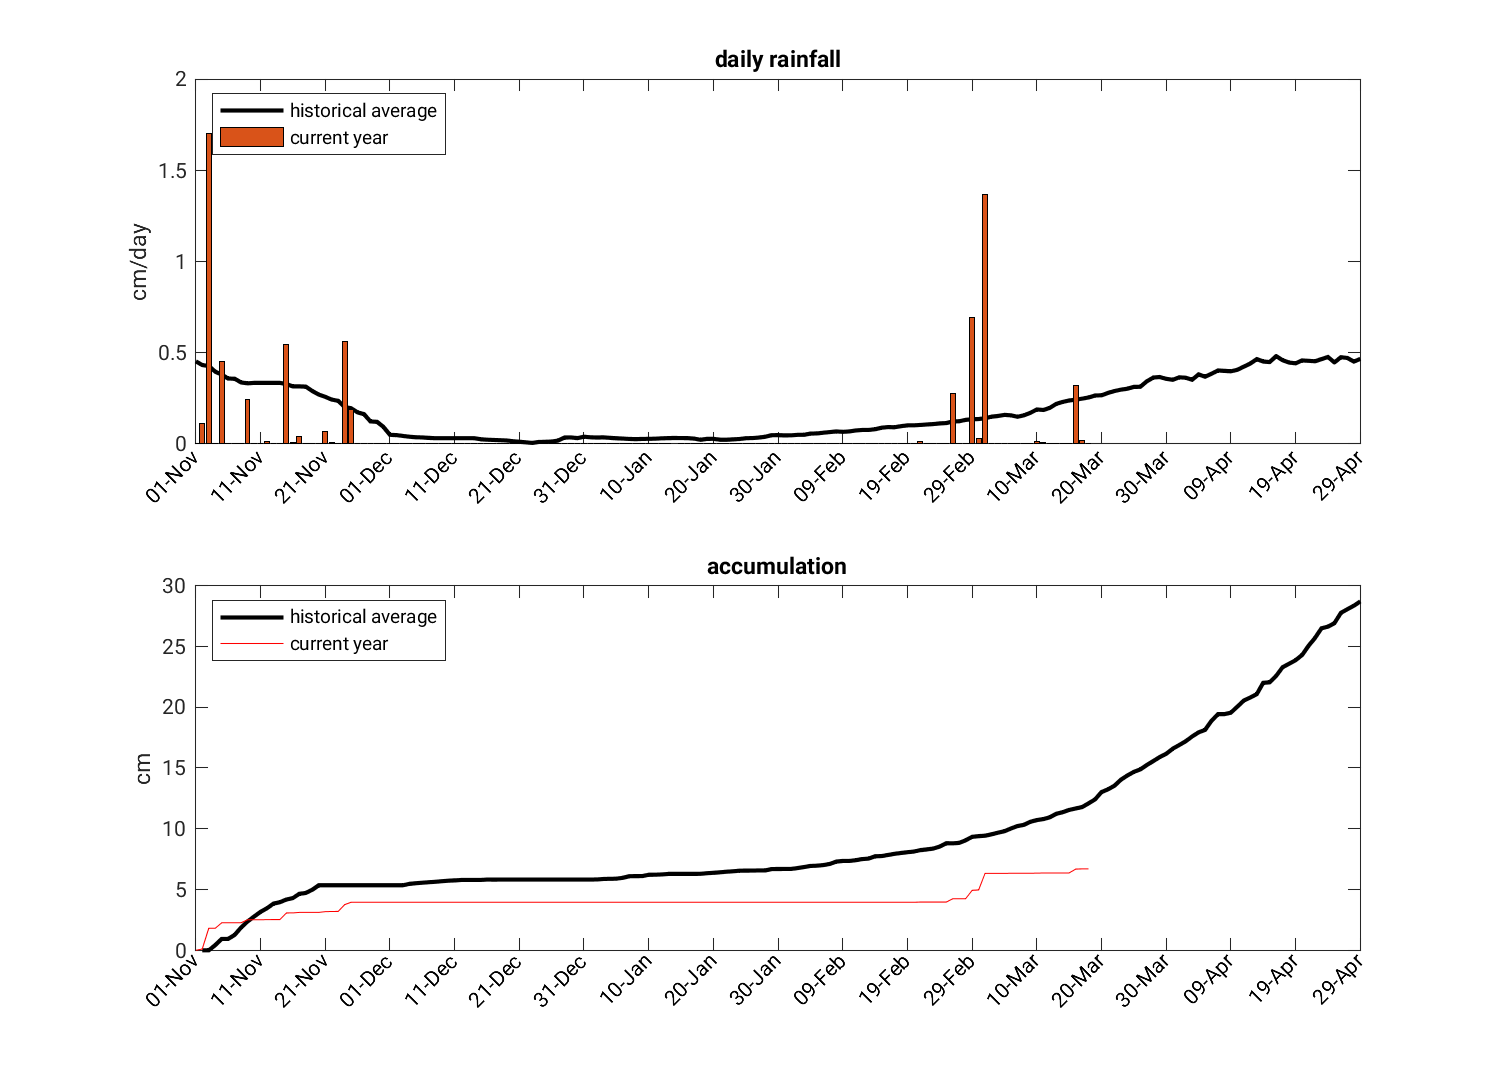
Seasonal rain accumulation
Also just for the city of New Haven, the below plots show the daily rainfall and the total seasonal accumulation of precipitation, compared to the historical average.

North America
Here are forecasts for the North American monsoon, which is most intense on the west coast of Mexico but does extend into the southwestern U.S.
Forecast for wind and precipitation
This animation shows the forecast of precipitation (color shading) and horizontal winds at 850 hPa, which is about 1.5 km above sea level. The precipitation is the accumulation over the previous 6-hour period, in millimeters (1 inch = 25 mm), and winds are measured in m/s (1 m/s = 2.2 miles per hour). This is from a single deterministic forecast. The red box outlines the region over which the total accumulation of rainfall for this season (shown below) is averaged.
All forecast data is from the Global Ensemble Forecast System (GEFS) of the U.S. National Centers for Environmental Prediction (NCEP). All forecasts use an initial atmospheric state at the time indicated on the plot (note that 00Z is midnight Universal Coordinated Time, which is 7 pm the previous day in western Mexico [CDT]).
Seasonal rain accumulation
Also for the main monsoon region (outlined in red on the above map), the below plots show the daily rainfall and the total seasonal accumulation of precipitation, compared to the historical average.

West Africa
Here are forecasts for the West African monsoon, which brings rain to the vast region of the Sahel just south of the Sahara desert.
Forecast for wind and precipitation
This animation shows the forecast of precipitation (color shading) and horizontal winds at 850 hPa, which is about 1.5 km above sea level. The precipitation is the accumulation over the previous 6-hour period, in millimeters (1 inch = 25 mm), and winds are measured in m/s (1 m/s = 2.2 miles per hour). This is from a single deterministic forecast. The red box outlines the region over which the total accumulation of rainfall for this season (shown below) is averaged.
All forecast data is from the Global Ensemble Forecast System (GEFS) of the U.S. National Centers for Environmental Prediction (NCEP). All forecasts use an initial atmospheric state at the time indicated on the plot (note that 00Z is midnight Universal Coordinated Time, which is 1 am in central Africa or 8 pm the previous day in New York [EDT]).
Seasonal rain accumulation
Also for the Sahel (red box in the above map), the below plots show the daily rainfall and the total seasonal accumulation of precipitation, compared to the historical average.
South Asia
Here are forecasts and rain accumulations for South Asia, which is home to the strongest monsoon on the planet.
Forecast for wind and precipitation
This animation shows the forecast of precipitation (color shading) and horizontal winds at 850 hPa, which is about 1.5 km above sea level. The precipitation is the accumulation over the previous 6-hour period, in millimeters (1 inch = 25 mm), and winds are measured in m/s (1 m/s = 2.2 miles per hour). This is from a single deterministic forecast. The red box outlines the region over which the total accumulation of rainfall for this season (shown below) is averaged.

All forecast data is from the Global Ensemble Forecast System (GEFS) of the U.S. National Centers for Environmental Prediction (NCEP). All forecasts use an initial atmospheric state at the time indicated on the plot (note that 00Z is midnight Universal Coordinated Time, which is 5:30 am in India or 8 pm the previous day in New York [EDT]).
Seasonal accumulation
The below plots show the daily rainfall and the total seasonal accumulation of precipitation, compared to the historical average, all averaged over the red box in the map above.

Global forecasts
Below are forecasts for the precipitation accumulation and maximum surface air temperature achieved during each of the next 3 days. These are deterministic forecasts, meaning a single forecast is issued based on the best guess of the current state of the atmosphere (without any consideration for our uncertainty about that state). All forecasts are direct output from the U.S. Global Forecasting System (GFS) model, and were initialized today at the time indicated below.
Day 1 forecast


Day 2 forecast


Day 3 forecast


Forecasts
Here you’ll find several types of forecasts:
- global, deterministic forecasts for the next 3 days
- probabilistic forecasts for several sites for the next 5 days:
- Kolkata (the Indian monsoon)
- Cameroon (the West African monsoon)
- Puerto Vallarta (the North American monsoon)
- New Haven, Connecticut, USA (far from any monsoon region, but the physical home of this website)
Cameroon Farm
Here are forecasts and rain accumulations for a point near Kumbo, Cameroon at 6.26°N, 10.95°E.
Forecast for wind and precipitation
This animation shows the forecast of precipitation (color shading) and horizontal winds about 1.5 km above sea level. The precipitation is the accumulation over the previous 6-hour period, in millimeters (1 inch = 25 mm), and winds are measured in m/s (1 m/s = 2.2 miles per hour). This is from a single deterministic forecast.
Seasonal rain accumulation
The below plots show the daily rainfall and the total seasonal accumulation of precipitation, compared to the historical average, for our point of interest (shown by the red star in the above map).
All forecast data is from the Global Ensemble Forecast System (GEFS) of the U.S. National Centers for Environmental Prediction (NCEP). All forecasts use an initial atmospheric state at the time indicated on the plot (note that 00Z is midnight Universal Coordinated Time, which is 1 am in central Africa or 8 pm the previous day in New York [EDT]).
Latest updates from the Famine Early Warning Systems Network
FEWS NET was created by USAID in 1985 to help with advance planning for possible humanitarian crises. They do not have staff in Cameroon, but monitor it from a neighboring country. Be sure to look at their latest updates on Cameroon, (always click through to “Read More” at the bottom), and also view their analyses of agriculture supply and price trends.
Southern African monsoon
While the African monsoon that is most widely known lies north of the equator and takes place during the northern hemisphere’s summer, a monsoonal circulation does exist over the southern part of the continent during the southern hemisphere’s summer. The precipitation maximum during this season stretches from Angola on the west coast of southern Africa all the way to Madagascar.
Forecast for wind and precipitation
This animation shows the forecast of precipitation (color shading) and horizontal winds at 850 hPa, which is about 1.5 km above sea level. The precipitation is the accumulation over the previous 6-hour period, in millimeters (1 inch = 25 mm), and winds are measured in m/s (1 m/s = 2.2 miles per hour). This is from a single deterministic forecast. The red box outlines the region over which the total accumulation of rainfall for this season (shown below) is averaged.

All forecast data is from the Global Ensemble Forecast System (GEFS) of the U.S. National Centers for Environmental Prediction (NCEP). All forecasts use an initial atmospheric state at the time indicated on the plot (note that 00Z is midnight Universal Coordinated Time, which is 2 am in central Africa [e.g. Johannesburg] or 7 pm in New York [EDT]).
Seasonal accumulation
The below plots show the daily rainfall and the total seasonal accumulation of precipitation for southern Africa (averaged over the red box shown above), compared to the historical average.
 Monsoon news from Google
- ETMarkets Smart Talk | Crude, monsoon hold the key to market direction in H2 2025: Bay Capital’s Nikunj Do - The Economic Times
- Onset of monsoon defers cloud seeding trial, new date to be announced later - The New Indian Express
- Utah's monsoon season is about to start at a helpful time for the state - KSL News
- Ahead of Maharashtra Assembly’s monsoon session, transit camp residents relocated - The Hindu
- Delhi, NCR likely to witness light rain, thunderstorms today as monsoon sets in - Hindustan Times
- Exclusive: Why Eye Infections And Allergies Increase During Monsoon, Expert Tips To Manage The Risk - Zee News